

1.2 - The Ideal Gas Law
Assumptions of the Ideal Gas Model
The classic ideal gas model rests on four assumptions:
- Random velocities. The instantaneous velocities of the atoms are random, so every direction is equally likely.
- Negligible atomic volume. The atoms take up basically no space compared to the total volume of the gas, so we treat them as point particles.
- Elastic collisions. When atoms collide, kinetic energy is conserved.
- No intermolecular forces. The only real forces happen during collisions, so there’s no attracting or repelling between collisions.
Real gases act close to ideal when the pressure is low and the temperature is high.
On the AP Physics 2 exam, ideal gases are also treated as monatomic (single atoms, like helium or argon) unless a problem says otherwise. The equation sheet lists this as one of the exam's conventions.
The Ideal Gas Law
An ideal gas follows this relationship:
where:
- = pressure (Pa)
- = volume (m³)
- = number of moles (mol)
- = universal gas constant = 8.31 J/(mol·K)
- = absolute temperature (K)
- = number of molecules
- = Boltzmann constant = J/K
The link between , , and Avogadro’s number is:
where molecules/mol.
There are two equivalent forms, and which one you use depends on what you’re given:
- Use when you’re working with moles.
- Use when you’re working with the number of molecules.
Special Cases and Relationships
Constant temperature (isothermal):
Constant pressure (isobaric):
Constant volume (isovolumetric, also called isochoric):
General case (combined gas law):
This one holds as long as the amount of gas stays constant.
Graphs of Gas Properties
Graphs of pressure, temperature, and volume let you describe or figure out the properties of a gas. Here are the common ones.
P vs. V (isotherms):
Hyperbolic curves, each representing constant temperature.
Higher temperature curves are farther from origin.
at constant T
V vs. T (isobars):
Straight lines through origin if T in Kelvin.
Different lines for different pressures.
Higher pressure → lower volume at same T
at constant P
P vs. T (isochores):
Straight lines through origin if T in Kelvin.
Different lines for different volumes.
Larger volume → lower pressure at same T
at constant V
Getting information from a straight-line graph. Rearrange the ideal gas law so it looks like , and the slope tells you something about the gas (temperatures in kelvins):
Graph | Held constant | Slope | Use the slope to find |
vs. | and | (if you know ) or | |
vs. | and | (if you know ) or | |
vs. | and | (if you know ) or |
Linearizing P vs. V. An isotherm on a P vs. V graph is a curve, which is hard to fit by eye. Plot against instead: for an ideal gas at constant temperature, the points fall on a straight line through the origin with slope .
If you plot temperature in °C instead of K, the slope stays the same (a change of 1°C equals a change of 1 K), but the line no longer goes through the origin.
Absolute Zero
You can find the temperature where an ideal gas would have zero pressure by extrapolating a graph of pressure versus temperature.
Starting from a P vs. T graph at constant volume:
- Plot pressure against temperature in Celsius.
- Extend the line down until .
- The intercept lands at T = -273.15°C = 0 K.
That point is absolute zero, the lowest temperature possible, where molecular motion theoretically stops.
Physically, at absolute zero, , so the molecules have zero kinetic energy.
Worked Example: Finding Absolute Zero From Data
A student seals some gas in a rigid 5.00 L container, warms it in a water bath, and records the pressure at six temperatures:
(°C) | 10 | 30 | 50 | 70 | 90 | 110 |
(kPa) | 104.0 | 110.7 | 118.4 | 125.8 | 133.9 | 140.4 |
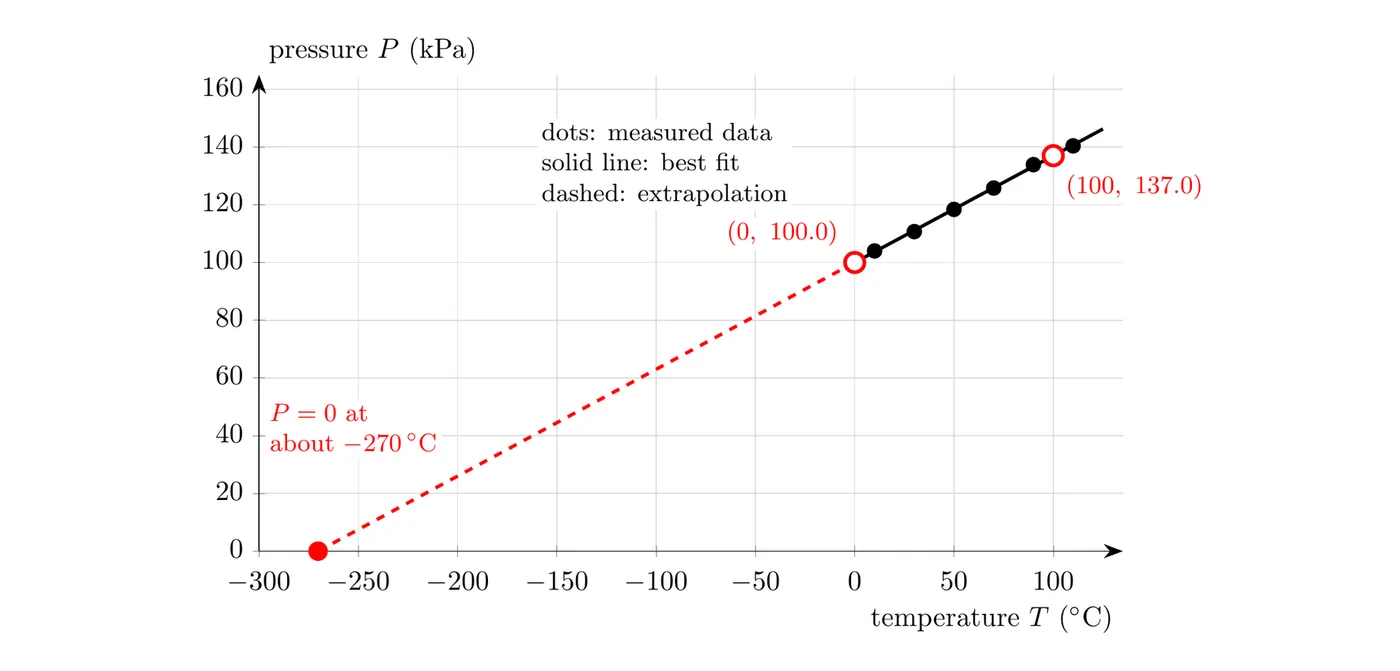
Step 1: slope. Use two points on the best-fit line, not two data points. The line passes through (0°C, 100.0 kPa) and (100°C, 137.0 kPa):
\text{slope} = \frac{137.0 \text{ kPa} - 100.0 \text{ kPa}}{100\,^{\circ}\text{C} - 0\,^{\circ}\text{C}} = 0.370 \text{ kPa}/^{\circ}\text{C}Step 2: extrapolate to zero pressure. Follow the line down from (0°C, 100.0 kPa) until :
T_{P=0} = 0\,^{\circ}\text{C} - \frac{100.0 \text{ kPa}}{0.370 \text{ kPa}/^{\circ}\text{C}} = -270\,^{\circ}\text{C}That's within about 1% of the accepted value, °C (0 K). Real data never lands exactly on it, so about °C from a graph like this is a good result.
Step 3: amount of gas. At constant volume , so the slope equals . In SI units the slope is 0.370 kPa/K Pa/K:
The number of atoms is atoms. (Using instead: gives the same answer.)
Practice Problems
1. A gas takes up 2.0 L at 300 K and 101 kPa. What volume does it take up at 400 K and 101 kPa?
2. A container holds 0.50 mol of gas at 300 K in a volume of 12.3 L. What is the pressure?
3. A gas at 200 kPa and 300 K is squeezed to half its volume at constant temperature. What is the new pressure?
4. How many molecules are in 2.0 mol of gas?
5. A gas has a pressure of 150 kPa at 27°C. If the volume stays constant, what is the pressure at 127°C?
Solutions
1.
Pressure is constant, so:
2.
Use the ideal gas law:
3.
Temperature is constant, so:
4.
5. Convert to Kelvin first: K, K.
Volume is constant:
Common Mistakes
- Using Celsius instead of Kelvin. Every gas law calculation needs absolute temperature in Kelvin.
- Using the wrong constant. Use J/(mol·K) with SI units, and don’t mix it up with .
- Mixing up and . is moles and is the number of molecules. They differ by a factor of .
- Wrong volume units. Convert liters to m³ when working in SI units: 1 L = m³.
- Assuming the ideal gas law always works. Real gases drift away from it at high pressure or low temperature.
- Forgetting what has to stay constant. When you use , the amount of gas has to be fixed.
- Extrapolating too far. The ideal gas law breaks down as T approaches 0, since real gases turn into liquids or solids first.