

8.13 - Dose Response Curve
Learning Objectives
The main objective is to evaluate a dose response curve. The associated skills are calculating a mathematical solution and using data to explain an environmental concept.
I. Plotting the Dose Response Curve
- Dose response curves plot the data from a dose response study.
- Percent mortality, or whatever effect is being studied, goes on the Y-axis.
- Dose concentration, the independent variable the scientist manipulates, goes on the X-axis.
- Curves typically follow an S-shape. Mortality is usually low at low concentrations, ramps up rapidly after the threshold, then levels off as it approaches 100%.
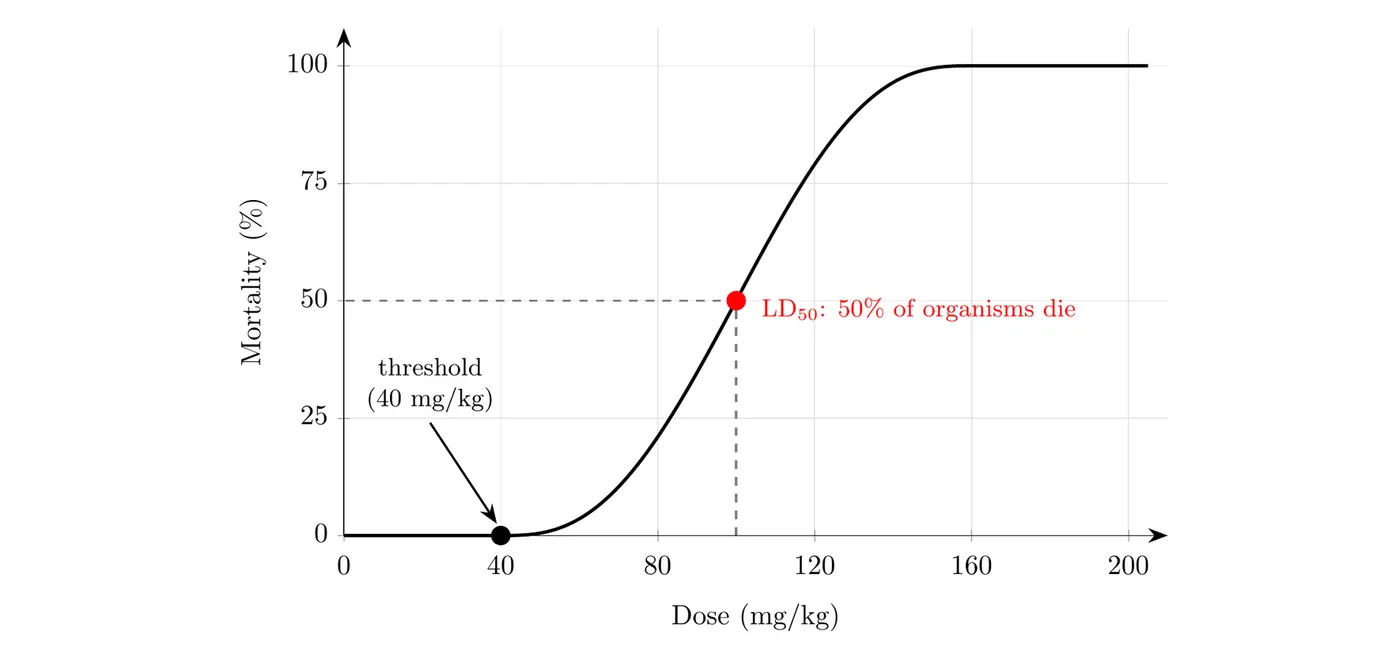
- The shape happens because different organisms have different tolerance levels.
II. Key Terms on the Curve
- Threshold: The lowest detectable level where a response shows up in the organism. For example, the threshold might be 40 milligrams per kilogram, where some organisms in the study started to die.
- : The lethal dosage that kills 50% of the organisms in the study.
- Reading from the graph: Find 50% on the y-axis, go across to the curve, then straight down to the x-axis. On the graph above, the is 100 mg/kg. The curve is steepest around the , so a small increase in dose there causes a big jump in deaths.
III. (Non-Lethal Effects)
- is the concentration at which 50% of the organisms in a study show some sort of response that’s a non-lethal effect.
- Sublethal effects are outcomes that don’t kill the organism but are measurable and quantifiable. Examples include infertility, paralysis, or developing cancer or a tumorous growth.
- A great example of is the concentration of the herbicide atrazine that causes 50% infertility in frog populations.
- When you compare lethal () and non-lethal () responses, the curve is generally shifted further to the right, meaning a higher dose, than the curve.
IV. Study Limitations
- Most dose response studies are acute (short-term), so they may not capture long-term developmental issues.
- Chronic studies are longer term, sometimes following an organism from hatching all the way through sexual maturity and adulthood.
V. Comparing Two Chemicals
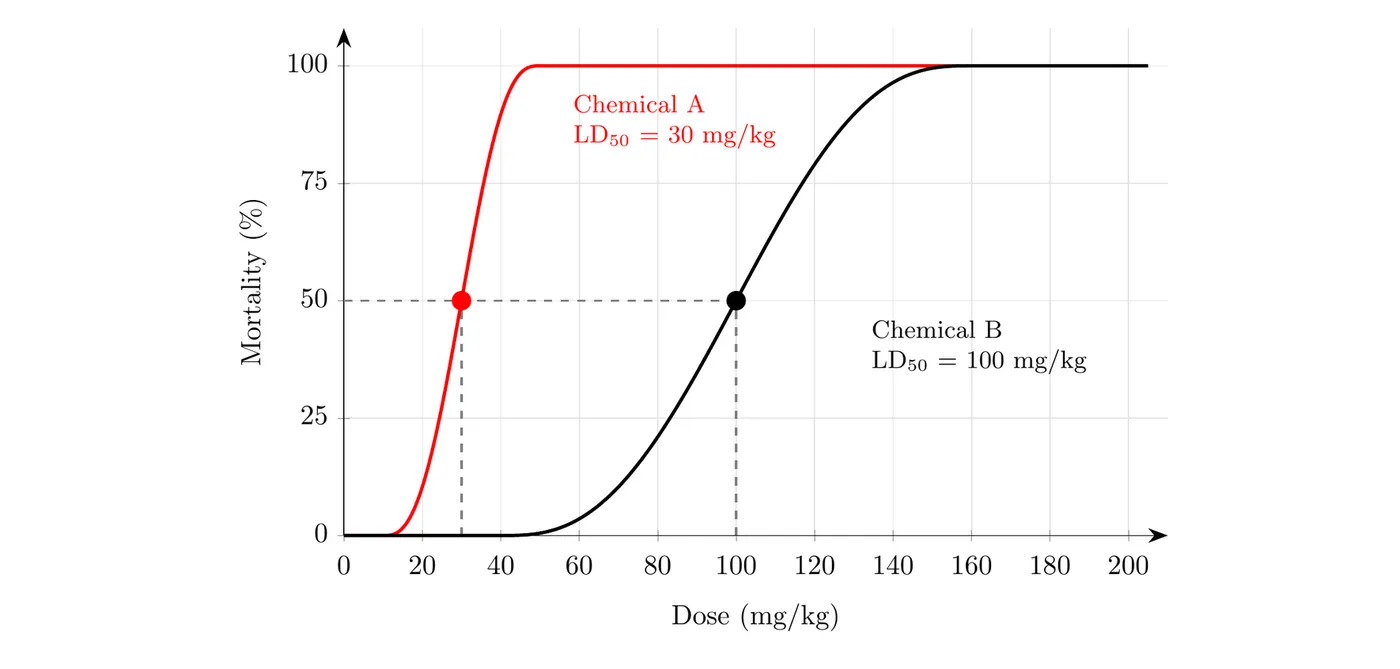
- Farther left = more toxic: The curve that sits farther to the left reaches 50% mortality at a lower dose. Here, chemical A’s is 30 mg/kg and chemical B’s is 100 mg/kg, so A is about 3.3 times as toxic as B ().
- Same dose, different results: At a dose of 50 mg/kg, chemical A kills 100% of the test organisms, while chemical B kills almost none (under 1%).
- Thresholds: Chemical A starts killing organisms at about 10 mg/kg, but B doesn’t until about 40 mg/kg, so a regulator would set a much lower safe limit for A.