

8.2 - Human Impacts on Ecosystems
Learning Objectives
The main objective is describing the effects of human activities on aquatic ecosystems. The associated skill is applying a mathematical relationship, like dimensional analysis or unit conversion, to solve a problem.
I. Range of Tolerance and Physiological Effects
- All organisms have a range of tolerance for the conditions of their habitat. Human actions can shift those conditions outside the range of tolerance.
- Optimum range: Inside its range of tolerance, every organism has an optimum range for each factor (temperature, pH, salinity, dissolved oxygen, and so on). In the optimum range it can maintain homeostasis, meaning it keeps its internal conditions, like body temperature and the salt balance in its blood, stable. Outside that range it has to spend extra energy just to cope, so it experiences physiological stress, limited growth, and reduced reproduction, and in extreme cases it dies (the zones of tolerance are in 2.4).
- Conditions defining tolerance include pH, temperature, salinity, sunlight, and nutrient levels. Organisms also have a range of tolerance for pollutants or toxicants.
- It’s crucial to cite specific physiological stressors or outcomes when discussing harm, rather than just saying an organism will die or be harmed.
- Specific physiological effects include limited growth, limited reproductive function (from impacted sexual organs or hormonal disruption), difficulty breathing or suffocation, and hormonal disruption caused by endocrine disruptors.
II. Environmental Effects of Acid Rain (pH Tolerance)
- All aquatic organisms have a range of pH tolerances. Certain species, like eel and brook trout, can tolerate lower pH better than others, like crustaceans.
- When water or soil becomes more acidic, meaning pH decreases, the effects that kill organisms include:
- Aluminum toxicity: Aluminum becomes more soluble and is toxic to many organisms, potentially damaging their nervous systems.
- Disrupted blood regulation: The ions in acidic conditions can disrupt the balance of sodium and chloride in the organism’s blood, which leads to death.
- Indicator species: Species with known pH ranges can be used as indicator species to assess environmental pollution. For instance, the presence of crustaceans and mollusks, which have calcium carbonate shells that deteriorate below a pH of 6, indicates the pH is likely higher than six.
III. Coral Reef Impacts: Temperature and Bleaching
- A coral reef is a mutualistic relationship between tiny animals called polyps (coral) and algae called zooxanthellae. The algae supply sugars, and the coral supply carbon dioxide and organic matter.
- The zooxanthellae have narrow temperature ranges. When the ocean warms, due to greenhouse gas emissions like from fossil fuel combustion, the algae are expelled from the coral.
- That expulsion causes the coral to lose its color and turn white, a process called coral bleaching. The coral becomes weaker and more susceptible to disease.
IV. Other Human Impacts on Coral Reefs
- Overfishing and bottom trawling: Bottom trawling is a harmful fishing practice where nets are dragged along the ocean floor. This physically breaks the coral reef and kicks up sediment, which makes the water dark and murky, clogs fish gills, limits visibility, and decreases sunlight penetration for algae.
- Other destructive fishing practices: Blast fishing uses explosives to stun or kill fish, which shatters the coral itself. Cyanide fishing squirts cyanide onto reefs to stun fish for the aquarium and live food fish trade, which also poisons the coral polyps.
- Runoff pollutants: Urban and agricultural runoff introduces various pollutants.
- Sediment pollution: Makes the water turbid (cloudy), which limits sunlight penetration for producers like algae and zooxanthellae.
- Toxicants: Synthetic chemicals like sunscreen, oil from roadways, and pesticides are directly lethal to organisms.
- Nutrients: Compounds like ammonia (from CAFOs), nitrate (from fertilizers), and phosphates (from detergents and fertilizers) are especially harmful.
V. Oil Spills: Effects and Cleanup
- Sources: Oil spills happen from a wellhead explosion (a blowout, like Deepwater Horizon) or a large tanker running aground (like the Exxon Valdez). An oil plume is a column of oil moving up through the water, and an oil slick is a patch on the surface.
- Toxicity and physical effects: Oil contains hydrocarbons that are toxic, especially if absorbed through the skin or gills, or ingested. Oil sticks to bird feathers, which limits their ability to fly and migrate, and it can sink to the bottom and smother bottom dwelling organisms.
- Fur and feathers: Oil that floats on the surface coats the feathers of birds and the fur of marine mammals. Oiled feathers and fur lose their waterproofing and insulation, so the animals can die of hypothermia, and they swallow toxic oil when they try to clean themselves. Sea otters have no blubber, so they depend completely on their fur to stay warm. After the Exxon Valdez spilled about 11 million gallons of crude oil in Alaska in 1989, an estimated 250,000 seabirds and 2,800 sea otters died.
- Estuary damage: Oil penetrates the roots of sensitive salt grasses and mangrove trees, poisoning them, which destabilizes the coast and leads to coastline erosion. The loss of those root systems also destroys prime breeding grounds for fish and shellfish.
- Economic impacts: Oil washing ashore forces beaches to shut down, which makes tourism revenue plummet, and it harms the fishing industry.
- Cleanup methods:
- Booms and skimming: Large plastic barriers (booms) contain the oil so it can be skimmed or vacuumed off the surface.
- Physical removal: Physically removing oil from the sand, rocks, and animals using towels or detergents.
- Chemical dispersants: Synthetic chemicals sprayed over the oil make it break up and spread out (dilution). The drawback: while it clears the surface, it causes the oil to sink, which affects bottom dwellers. The dispersants themselves may also be toxic.
VI. Dead Zones and the Oxygen Sag Curve
- Oceanic dead zones: Areas of the ocean with so little dissolved oxygen (DO) that most marine life can’t survive there. They’re caused by nutrient pollution: nitrogen and phosphorus from fertilizer runoff and sewage trigger algal blooms, and when the algae die, bacteria use up the oxygen while decomposing them (the full process is in 8.5).
- Example (Gulf of Mexico): The Mississippi River drains about 41% of the continental US, including the Corn Belt, and carries fertilizer nitrogen into the Gulf every spring. The dead zone that forms each summer off Louisiana and Texas reached a record 8,776 square miles in 2017. Its size also depends on the weather: in 2026, NOAA forecast about 7,000 square miles, but low river flow and the winds and waves of Tropical Storm Bertha mixed oxygen back into the water, and the zone that scientists from LSU and LUMCON mapped in late July 2026 was only about 1,332 square miles, the third smallest since mapping began in 1985.
- Oxygen sag curve: A graph of dissolved oxygen (y-axis) against distance downstream from a source of pollution (x-axis). The source is usually a pipe releasing sewage, other organic waste, or excess nutrients. It’s called a sag because DO dips below normal and then slowly recovers.
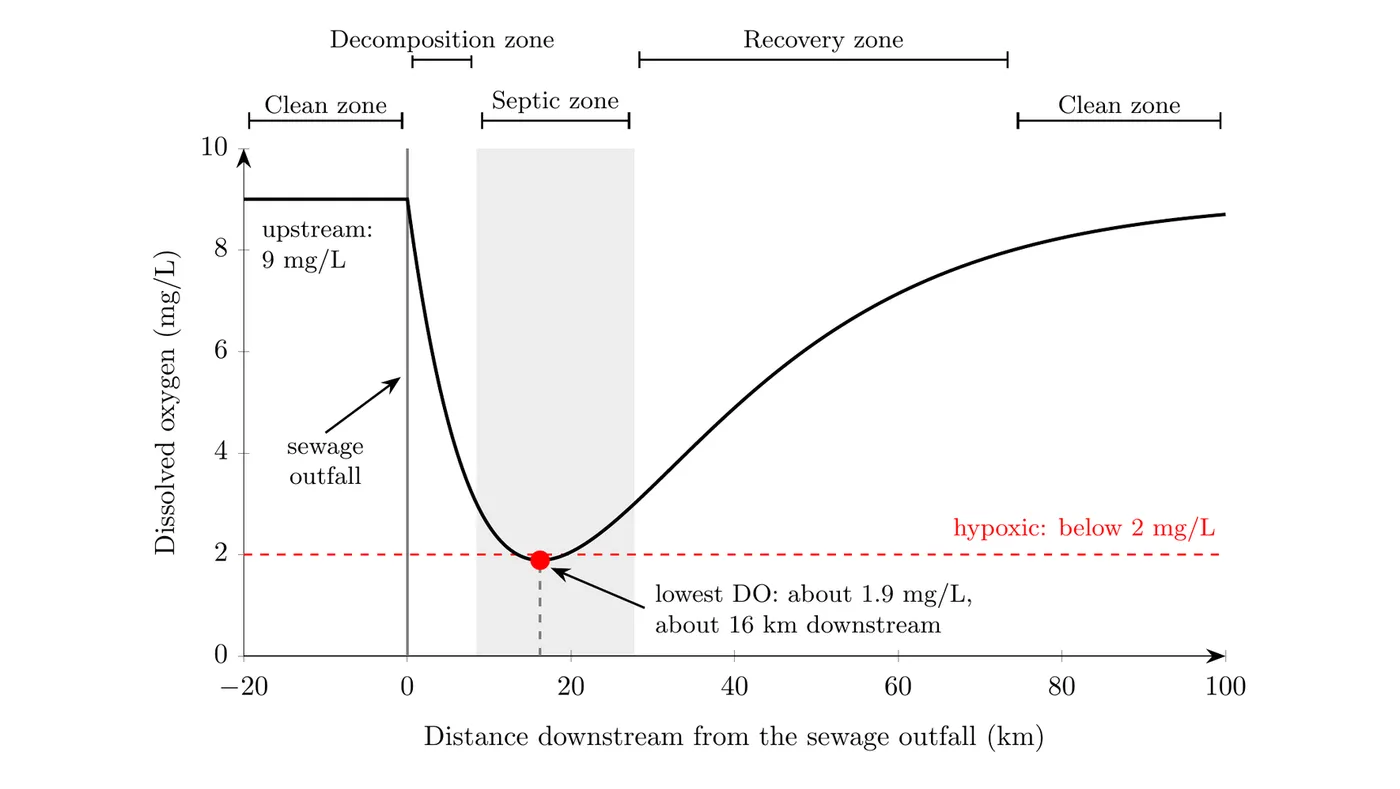
- Reading the curve (graph above):
- Clean zone (upstream): DO is high, about 9 mg/L here, and the stream supports organisms that need a lot of oxygen, like trout and mayfly larvae.
- Decomposition zone: Right below the outfall, aerobic bacteria start breaking down the organic waste. Their respiration uses up oxygen faster than it can dissolve back in from the air, so DO drops quickly. Fish that tolerate less oxygen, like carp, replace the trout.
- Septic zone: The bottom of the sag, where DO is lowest. Here it falls to about 1.9 mg/L roughly 16 km downstream, which is hypoxic. Most fish die or leave, and only low oxygen specialists like sludge worms and bacteria do well.
- Recovery zone: Most of the waste has been decomposed, so bacteria use less oxygen, while oxygen keeps dissolving in from the air and from photosynthesis. DO rises again, and by about 74 km downstream it’s back to 8 mg/L.
- Clean zone (downstream): DO is back near its normal level, and clean water species return.
- Connection to BOD: Biochemical oxygen demand (BOD) is how much oxygen bacteria need to break down the organic matter in water. BOD jumps at the outfall and then falls downstream as the waste gets used up. DO hits its lowest point a little farther downstream than the outfall, because it takes time for the bacteria to use up the oxygen.
- Making the sag smaller: Anything that puts less organic matter and fewer nutrients into the river helps, like better sewage treatment before discharge (see 8.11) or less fertilizer runoff. Warm water makes the sag worse, since it starts out holding less oxygen (see 8.6).
VII. Heavy Metals, Litter, and Sediment
- Heavy metals in groundwater: Industry, especially mining and burning fossil fuels, releases heavy metals like mercury, lead, arsenic, and cadmium. Rain can leach these metals out of mine waste, coal ash ponds, and landfills, and the water carries them down through the soil into aquifers. People who drink from wells that tap those aquifers are exposed, and since metals never break down, the contamination can last for decades.
- Example (coal ash): The ash left over from burning coal holds concentrated arsenic, lead, and mercury. When it’s stored in unlined ponds, those metals can leak into nearby groundwater (more in 8.3).
- Mercury and methylmercury: When elemental mercury (from burning coal or from gold mining) reaches lakes, rivers, or wetlands, bacteria in the water and mud convert it into methylmercury. This form is highly toxic, animals absorb it easily, and it biomagnifies up food chains (see 8.8).
- Litter: Trash that reaches rivers and oceans, especially plastic, does more than look bad.
- Blockage and choking: Animals mistake plastic for food. Sea turtles eat plastic bags that look like jellyfish, and seabirds like albatrosses scoop up floating plastic and feed it to their chicks. The plastic can block the gut or cause choking, and a stomach full of plastic makes an animal feel full while it starves.
- Toxins in the food chain: Plastics contain additives like phthalates, and floating plastic soaks up POPs like PCBs from the water. When animals eat plastic, including microplastics (pieces smaller than 5 mm), those chemicals move into their tissues and up the food chain.
- Sediment: Erosion from construction, farming, logging, and mining washes soil into waterways.
- Less light: Suspended sediment makes the water turbid (cloudy) and blocks sunlight, so producers like algae, seagrass, and the zooxanthellae in coral photosynthesize less. Visual predators, like trout and kingfishers, can’t see their prey as well.
- Smothered habitats: When sediment settles, it covers the bottom. It can bury coral and shellfish beds and fill in the gaps in gravel streambeds where fish like salmon and trout lay their eggs, so the eggs don’t get enough oxygen.
Big picture: Marine ecosystems face severe threats as human activity shifts environmental conditions beyond the range of tolerance for species. Rising ocean temperatures cause mass coral bleaching by forcing the symbiotic zooxanthellae algae to abandon their hosts, while pollutants from runoff and oil spills introduce specific threats like aluminum toxicity (from lowered pH) and hydrocarbon poisoning.