

9.4 - Increases in the Greenhouse Gases
Learning Objectives
The main objective is to describe both the environmental consequences and the human health effects of increasing greenhouse gases in our atmosphere. The associated skill is explaining how an environmental concept represented visually relates to a broader environmental concept.
I. Environmental Impacts of Rising Sea Level
Increasing greenhouse gas concentrations lead to global warming, which causes sea level rise through two main effects:
- Thermal Expansion: When water warms, its molecules move faster and spread a little farther apart, so the same mass of water takes up more space. That tiny expansion, multiplied across the whole ocean, adds up to a measurable rise in sea level. In 2024, thermal expansion caused about two-thirds of that year's rise (NASA).
- Melting Polar and Glacial Ice: Higher temperatures melt the ice sheets in glaciers and the ice caps at the poles. That water, which used to be stored as ice, then flows into the ocean.
- Only land ice raises sea level: melting glaciers and the ice sheets on Greenland and Antarctica add new water to the ocean. Melting sea ice (like the floating Arctic ice cap) barely changes sea level, because floating ice already pushes aside its own weight in water, the same way melting ice cubes don't make a full glass overflow.
As a result, from 1993 to 2018, global ocean level rose over eight centimeters. By 2024 the total since 1993 was about 10 centimeters (4 inches), and the yearly rate had more than doubled, reaching about 0.59 cm a year in 2024 (NASA satellite data). The IPCC (2021) projects roughly another 0.3 to 1 meter by 2100, depending on how much we emit. That rise leads to several environmental consequences:
- Flooding of Coastal Ecosystems: Sea level rise floods coastal ecosystems like salt marshes and mangroves. These areas get converted from highly productive, unique ecosystems into open ocean. They’re valuable as storm buffers and as sources of biodiversity and commercial fishing.
- Loss of Polar and Tundra Ecosystems: Disproportionate warming at the poles shrinks habitat for organisms like polar bears, penguins, and reindeer, which can lead to a decrease in biodiversity.
- Disruption of Water Sources: Warming disrupts the freeze-thaw cycle of glaciers, which are vital water sources for surrounding ecosystems and human communities. The loss of glacial cover, like what’s been seen in Alaska between 1941 and 2004, deprives those ecosystems of that important water source.
II. Human Impacts of Rising Sea Level
- Relocation of Communities: Many coastal communities may have to relocate inland, especially those in low-lying areas like New Orleans, which is already below sea level and protected by complex systems of levees and pumps.
- Increased Flood Frequency and Severity: Sea level rise means more frequent and more severe floods. That causes property damage, displacement, higher insurance costs, and potentially complete property loss.
- Saltwater Intrusion: Rising sea levels increase pressure on the water table, causing salt water to intrude or seep into freshwater groundwater sources. That contaminates wells in low-lying coastal regions, making it hard to support agriculture and human drinking water.
- Refugee Crisis: Increased displacement could mean a huge increase in the number of refugees. Refugees are often displaced temporarily and struggle to find new places to relocate, especially in less developed nations that lack housing infrastructure and government assistance.
- Real Example (Isle de Jean Charles, Louisiana): this island community has lost about 98% of its land since 1955 to sea level rise, sinking land, and erosion. In 2016 the federal government (HUD) gave Louisiana about $48 million to move its residents, many of them members of a Native American tribe, to higher ground about 40 miles north. It's often called the first federally funded climate relocation in the US.
III. Disease Vectors and Climate Change
- Vector Definition: Disease vectors are living organisms like mosquitoes, fleas, and ticks that carry a pathogen and transmit it from one organism to another. They transmit deadly diseases like malaria, Zika virus, West Nile virus, dengue fever, and Lyme disease. (Cholera is different: it's caused by bacteria in contaminated water, not spread by a vector, although warmer water and flooding can help it spread too.)
- Extended Range: The planet is warming because of increasing greenhouse gases. Since insects depend on warmer temperatures, that warming will extend and increase the range for many vectors.
- Vectors will spread out from the equator toward the poles as higher and lower latitudes become warm enough for them to survive. That puts new human populations at risk of these diseases.
- Uphill Too: vectors also spread to higher elevations as mountains warm. In the highlands of Ethiopia and Colombia, malaria cases show up at higher altitudes in warmer years (Siraj and others, 2014).
- Example (Lyme disease): the blacklegged tick that spreads Lyme disease has been expanding north into Canada as winters get milder, bringing the disease to places that never had it.
- Example (Aedes aegypti mosquito): This species, which transmits dengue fever, zika virus, and yellow fever, is projected to have a substantially extended range toward northern latitudes by the year 2080 if global warming continues. On the flip side, some equatorial regions may get too hot and pass beyond the optimal conditions for the mosquito, so they’d actually see less disease transmission.
- Other Species Move Too (Population Dynamics): as climate zones shift, many plants and animals are moving their ranges toward the poles and up mountains. A 2011 analysis of hundreds of species found ranges shifting poleward about 17 km per decade and uphill about 11 m per decade (Chen and others, 2011). Species that can't move fast enough decline (9.9).
IV. Measuring the Increase: The Keeling Curve
The Keeling curve is the record of measured at Mauna Loa Observatory in Hawaii since 1958, started by the scientist Charles David Keeling. It's the most famous graph in climate science, and you should be able to read it.
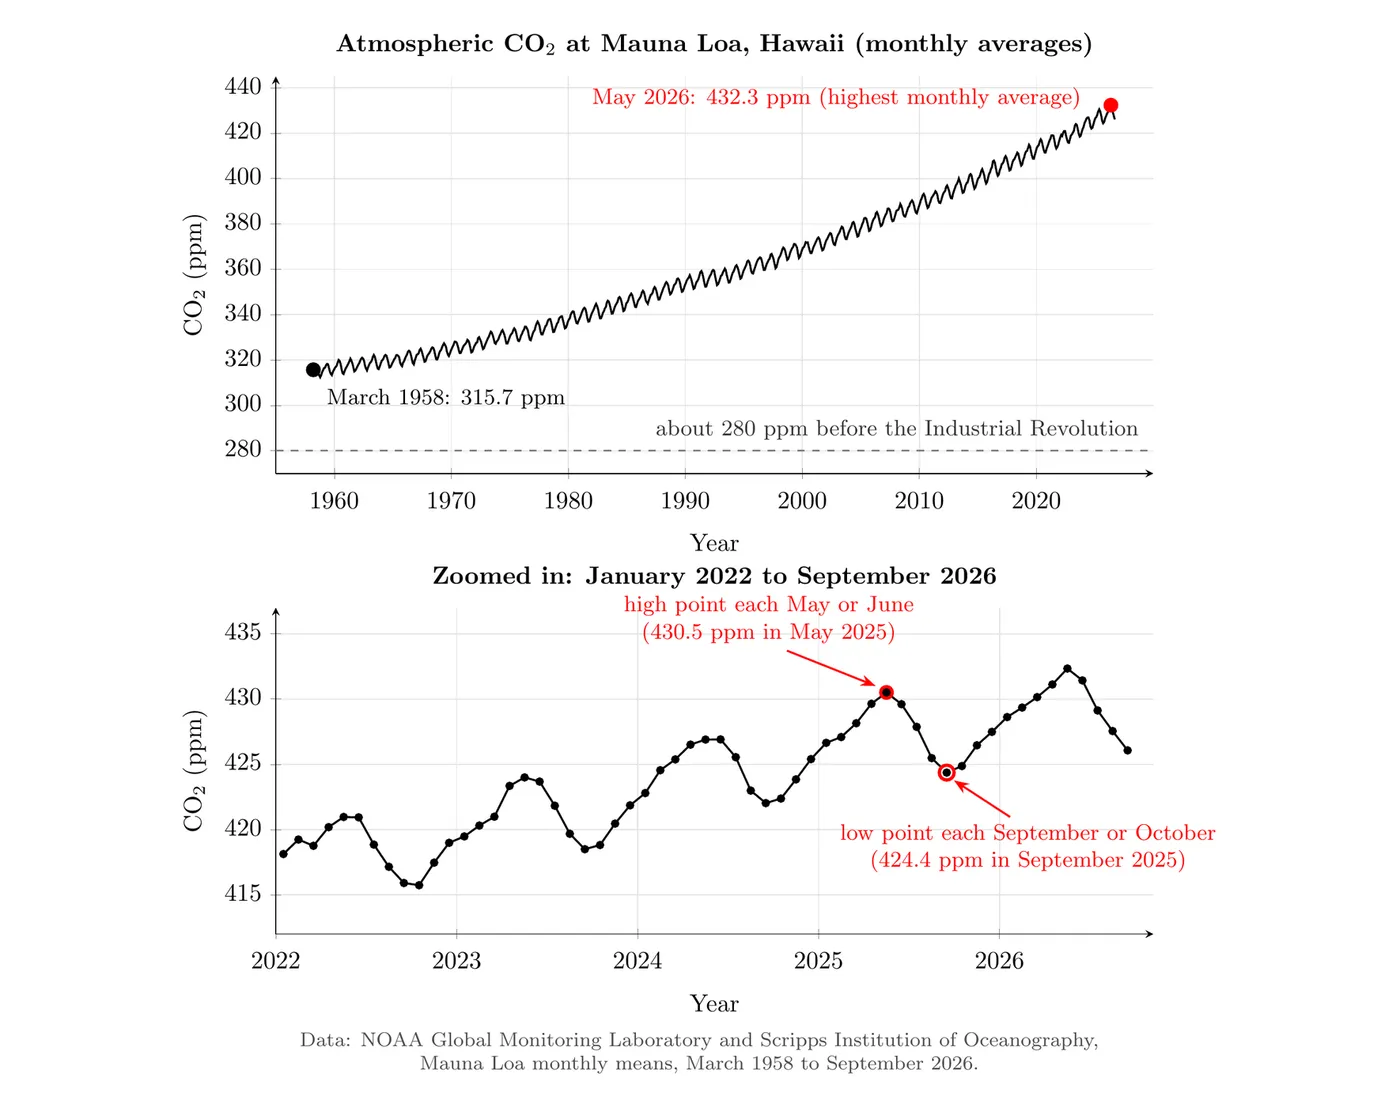
- Long-term rise (human activity): went from 315.7 ppm in March 1958 to a record monthly average of 432.3 ppm in May 2026. The yearly average was 427.35 ppm in 2025, about 53% above the roughly 280 ppm before the Industrial Revolution and higher than at any time in at least 800,000 years (9.5). The rise is speeding up: about 0.9 ppm a year in the 1960s, but about 2.4 ppm a year in the 2010s (NOAA data, as of 2026).
- Seasonal zigzag (photosynthesis): each year peaks in May or June and bottoms out in September or October. Most of Earth's land plants are in the Northern Hemisphere. In spring and summer they photosynthesize faster than living things respire, pulling out of the air. In fall and winter, leaves drop and photosynthesis slows, while respiration and decomposition keep releasing . In 2025 the swing was about 6 ppm (430.5 ppm in May down to 424.4 ppm in September).
- Other gases are rising too: in 2024, methane averaged about 1,942 ppb worldwide, about 2.7 times its pre-industrial level, and averaged about 338 ppb, about 25% higher (WMO).
- Reading it on the exam: the long upward slope is the human signal (burning fossil fuels and deforestation). The yearly up-and-down is the natural seasonal signal. If a question asks why the line zigzags, answer with photosynthesis and respiration, not human activity.
Big picture
The increase in greenhouse gases is driving sea level rise through thermal expansion and the melting of polar and glacial ice. That causes major environmental harm, including the flooding and loss of productive coastal wetlands and the disruption of vital water sources for ecosystems. On top of that, global warming is expanding the habitat range of disease vectors like the Aedes aegypti mosquito, which threatens new human populations with diseases like malaria and zika virus.