

9.5 - Global Climate Change
Learning Objectives
The main objective is to explain how both short and long-term changes in Earth’s climate will impact Earth’s ecosystems. The associated skill is using data to support a hypothesis.
I. Historic Climate Change (Natural Cycles)
Long-term climate change happens naturally as a result of Earth’s varying orbit.
- Eccentricity: How Earth’s orbit changes in terms of how circular it is. The orbit shifts on a roughly 100,000-year cycle, going from nearly circular to eccentric, which takes it further away from the sun.
- Obliquity: How tilted Earth's axis is. The tilt shifts between about 22.1° and 24.5° on a roughly 41,000-year cycle (it's about 23.4° today). More tilt means stronger seasons: summers at high latitudes, where most of Earth's ice is, get more direct sunlight, so more ice melts and the climate warms. Less tilt means cooler summers, so snow survives the summer and ice sheets grow.
- Precession: Earth's axis also slowly wobbles like a spinning top (one wobble takes about 26,000 years). This changes whether Northern Hemisphere summer happens when Earth is closest to the sun or farthest from it, which gives a climate cycle of about 19,000 to 23,000 years.
- Milankovitch Cycles: Predictable, roughly 100,000-year variations in Earth’s climate that result from how direct or indirect the solar radiation Earth receives is. These cycles produce alternating ice ages and warmer periods.
II. Earth’s Historical Climate Evidence
Scientists use three main types of evidence to establish Earth’s temperature and levels over the past 800,000 years:
- Foraminifera Shells: These tiny organisms on the ocean floor leave shells in sediment layers. Since different species prefer different temperatures, their presence helps predict past temperatures.
- Air Bubbles in Ice Cores: Different layers of ice, formed at a predictable rate, contain air bubbles that are basically tiny snapshots of the atmosphere at that time. Scientists can melt the cores, test the air, and determine historical carbon dioxide levels.
- Oxygen Isotopes: The ratio of heavy oxygen () to light oxygen () can estimate past temperatures, but it reads in opposite directions in ice and in ocean sediments. Water made with the lighter evaporates more easily. In ice cores, more in the ice means it was warmer when the snow fell. In ocean sediments (foraminifera shells), more means it was colder, because during ice ages lots of light is locked up in ice sheets, which leaves the ocean richer in .
III. Historical Trends and Causality
- Historical data shows that carbon dioxide and temperature are strongly correlated over the past 800,000 years.
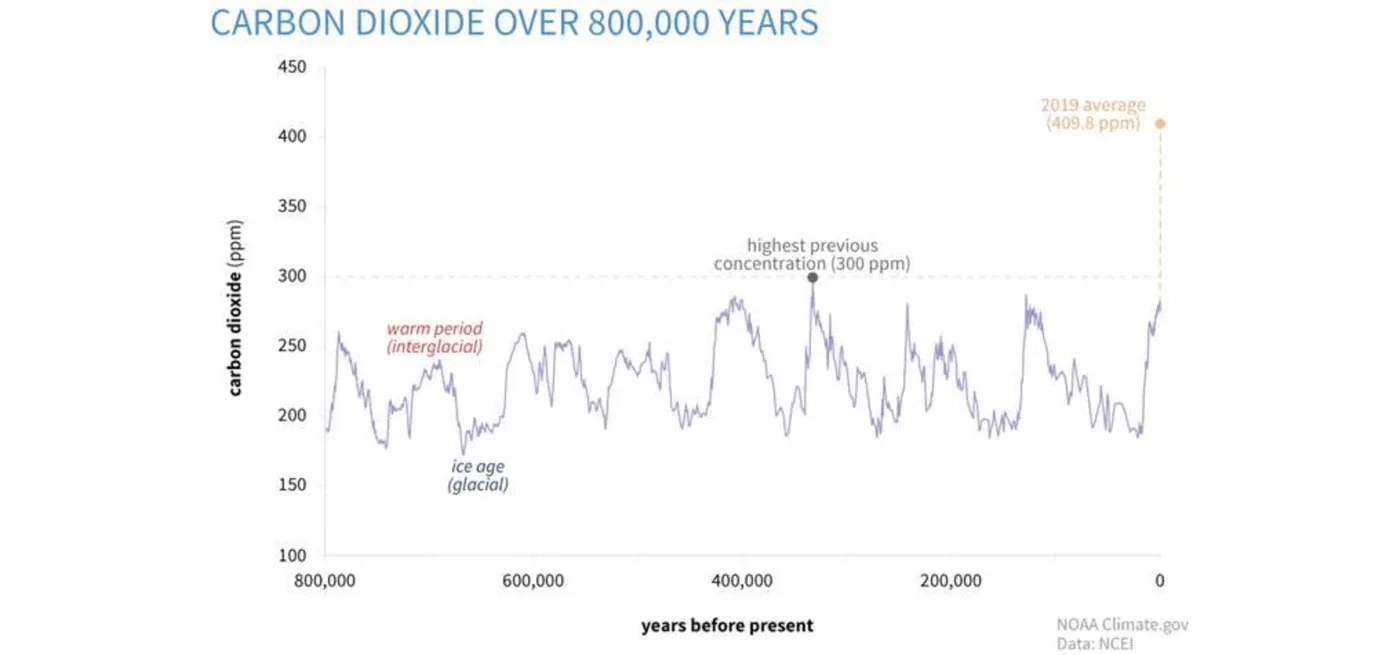
- Causality: In past ice age cycles, changes in Earth's orbit (Milankovitch cycles) started the warming. The warming made the oceans release (warm water holds less gas), and that trapped more heat and amplified the warming, a positive feedback. So in the past, acted as both an effect and a cause. Today the order is different: humans are adding the first by burning fossil fuels, and temperature is following. The IPCC's 2021 report calls human-caused warming of the atmosphere, ocean, and land unequivocal.
- Current Concern: Current levels are far higher than at any point in the past 800,000 years, which is cause for concern about short-term temperature changes.
- Ice cores show stayed between about 180 and 300 ppm for 800,000 years. The yearly average at Mauna Loa was 427.35 ppm in 2025 (NOAA; the Keeling curve is in 9.4). The graph above stops at 2019.
IV. General Environmental Effects of Climate Change
- Global Warming: The expected continued trend of increased average surface temperature.
- How much so far: 2024 was the warmest year on record, about 1.55°C above the 1850 to 1900 average and the first calendar year above 1.5°C. 2025 was the second or third warmest (about 1.44°C) even with La Niña cooling it, and 2023 to 2025 are the three warmest years on record (WMO, January 2026). The Paris goal (XI) is about the long-term average, so one hot year doesn't break it by itself.
- Biodiversity Loss: Habitats may get too dry and be lost, which contributes to extinction rates far faster than background rates and could lead to a sixth mass extinction.
- Drought and Desiccation: Certain regions will see prolonged drought. Rising temperatures lead to soil desiccation, meaning drying, which leaves the soil unable to hold moisture or support crops. Other regions, like the tropics, may actually get increased precipitation.
- Soil: changes in temperature and rainfall change how usable soil is. Hotter, drier soil loses moisture and organic matter, holds together less, and blows away more easily (wind erosion, like the 1930s Dust Bowl). Where rain comes in heavier downpours, more topsoil washes away (water erosion). Warmer soil also speeds up decomposition, which releases and leaves less humus to hold water and nutrients.
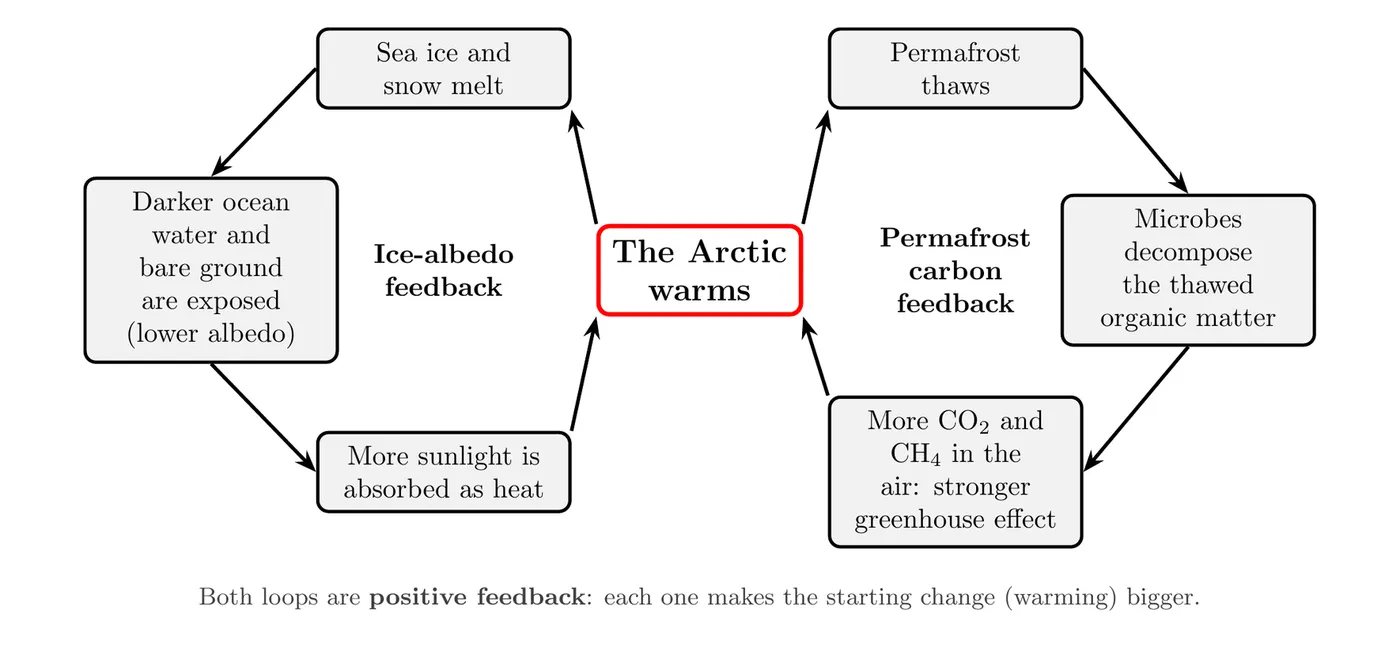
- Melting Permafrost (Positive Feedback Loop): The melting of permanently frozen ground in the tundra drives anaerobic decomposition of the organic matter underneath. That releases large amounts of methane () and carbon dioxide (), which trap heat and cause further melting. That’s a positive feedback loop.
- Melting Sea Ice: Arctic sea ice in September (its yearly low) has shrunk about 12% per decade since satellite records began in 1979 (NSIDC). The record low was in 2012, about 3.4 million square kilometers. The 2026 low, about 4.6 million square kilometers, tied for 10th lowest, and the last 20 summers (2007 to 2026) are the 20 lowest on record (NASA and NSIDC).
V. Impacts on Coastal Communities
- Displacement: As sea level rises from melting ice and thermal expansion, many coastal communities will be displaced and forced to become refugees.
- Mitigation: Wealthier areas might delay displacement by building higher sea walls or putting houses on stilts.
- Loss of Barrier Islands: Rising sea level will inundate and flood the small, protective barrier islands that buffer the shoreline, which means habitat loss and the removal of that buffering service for coastal communities.
VI. Impact on Atmospheric Currents
- Winds Move Heat: The equator gets far more solar energy than the poles (4.7). Atmospheric circulation, the Hadley, Ferrel, and polar cells and the winds they make (4.5), carries warm air toward the poles and cool air toward the equator. Without it, the tropics would be much hotter and the poles much colder.
- Hadley Cell: The Hadley cells have likely widened toward the poles since the 1980s (IPCC, 2021), and models project they'll keep expanding and get weaker as the planet warms. The dry, sinking air at the edge of each Hadley cell (about 30° N and S) makes the world's big deserts. As that edge moves toward the poles, dry subtropical weather spreads into places like the Mediterranean, the US Southwest, and southern Australia.
- Polar Jet Stream Destabilization: The Arctic is warming faster than the tropics, so the temperature difference between them is shrinking. Many scientists think that weakens the polar jet stream and makes it wobblier, but they still debate how strong this effect is.
- A wobbling jet stream can push warm air north in one area and cold air dramatically south in another, and can make weather patterns stall. Some researchers linked the 2014 polar vortex cold outbreak in the Midwest and Eastern Seaboard to this.
VII. Impact on Marine Ecosystems
- Photic Zone Shift: Rising sea level makes some areas too deep for sunlight, so the photic zone shifts upward and producers like algae have to migrate.
- New Habitat (a positive effect): Rising seas also flood low coastal land and continental shelves, creating new shallow, sunlit habitat that seagrasses, kelp, corals, and fish can move into, if they can spread fast enough. This has happened before: when the last ice age ended, sea level rose about 120 m and flooded the land between Britain and mainland Europe, which became the southern North Sea.
- Fishery Loss: Fish need narrow temperature ranges adapted to specific oxygen conditions. As water warms and dissolved oxygen drops, fish have to migrate to colder waters, which decreases the Maximum Sustainable Yield (MSY) for many fisheries.
VIII. Impact on Ocean Circulation (Thermohaline)
- The thermohaline circulation, Earth’s conveyor belt, redistributes heat, nutrients, and oxygen globally.
- Slowing Down: The North Atlantic part of the conveyor belt is called the AMOC (Atlantic Meridional Overturning Circulation). The IPCC (2021) says it will very likely weaken during this century as the climate warms.
- Mechanism: Melting ice from the Greenland ice sheets adds cold fresh water to the North Atlantic. That fresh water is less dense than salt water, so it stays on the surface instead of sinking.
- Consequences: A weaker AMOC carries less warm water north. That could mean cooler temperatures for northwestern Europe (which the Gulf Stream and AMOC normally keep mild), faster sea level rise along the US East Coast, and less mixing of nutrients and oxygen in the ocean. The IPCC doesn't expect a full shutdown before 2100 (medium confidence), but a shutdown would be a much bigger shock, and some newer studies warn the risk may be higher than that.
IX. Unequal Global Warming (Polar Amplification)
The polar regions are warming faster than anywhere else, a concept called polar amplification.
- Land Mass: The Northern Hemisphere has more land, and land has a lower specific heat than ocean. So that land warms up faster than the ocean, and winds carry some of that heat north to the Arctic ice.
- Albedo Positive Feedback Loop: Melting sea ice exposes dark open ocean (low albedo), which absorbs more sunlight, generates more heat, and melts more ice nearby, which is a positive feedback loop.
- Fresh snow reflects about 80 to 90% of sunlight and sea ice about 50 to 70%, but open ocean reflects only about 6%. So each patch of ice that melts swaps one of Earth's brightest surfaces for one of its darkest.
- Thermohaline Redistribution: The thermohaline circulation carries warm surface water from the equator toward the poles, redistributing heat to those regions.
- Air Pollution: Particulate matter (soot) falls onto the ice, lowering its albedo by making it darker, so it absorbs more heat.
- Permafrost Feedback: Thawing permafrost releases and methane (see IV), which adds to the warming that thawed it. Arctic permafrost holds about twice as much carbon as the atmosphere does today.
How fast: since 1979 the Arctic has warmed nearly four times faster than the world as a whole (Rantanen and others, 2022). The two big Arctic feedback loops:
X. Impact on Polar Ecosystems
- Habitat Loss: The loss of arctic ice means the loss of habitat, or substrate, for algae, and the loss of resting areas for seals.
- Polar Bears: They rely on the ice to hunt seals, so decreasing ice cover makes hunting harder and forces them to swim longer distances.
- Food Web Effects: Algae growing on the underside of sea ice are the base of the Arctic food web. Zooplankton eat them, Arctic cod eat the zooplankton, and seals, whales, and seabirds eat the cod, so less ice means less food all the way up.
- Walruses: Pacific walruses rest on sea ice between dives for clams on the seafloor. In years when the ice retreats past the shallow feeding areas, thousands crowd onto Alaska's beaches instead, where stampedes can crush the young.
XI. Responding to Climate Change: International Agreements
- Kyoto Protocol (1997): the first treaty with binding cuts in greenhouse gas emissions, but only for developed countries. The US signed it but never ratified it, and its last commitment period ended in 2020.
- Paris Agreement (2015): nearly every country agreed to keep warming well below 2°C above pre-industrial levels and to try to limit it to 1.5°C. Each country sets its own target, called a nationally determined contribution (NDC), and has to update it every five years. The targets themselves aren't legally binding.
- The US and Paris (as of 2026): the US joined in 2016, left in November 2020, rejoined in February 2021, and left again on 27 January 2026, one year after President Trump gave notice. In January 2026 the White House also announced that the US would leave the UNFCCC, the 1992 UN climate treaty the Paris Agreement is built on.
- The 1.5°C line: the goal refers to a long-term (about 20-year) average. Single hot years can pass 1.5°C before the average does, as 2024 did. The IPCC (2021) expected the long-term average to reach 1.5°C around the early 2030s.
Big picture
This is the full sweep of global climate change, from natural Milankovitch cycles to the destructive positive feedback loop caused by melting permafrost, and the destabilization of the polar jet stream.