

4.2 - Change in Momentum and Impulse
Newton’s Second Law, Alternative Form
The familiar form of Newton’s Second Law is , but there’s an equally fundamental form written in terms of momentum:
This says the net external force on an object equals the rate at which its momentum changes.
For constant mass, this reduces to , recovering the familiar form. This momentum-based version is more general and powerful, especially for variable mass systems (rockets burning fuel), collisions and explosions, and situations where force changes over time.
The AP equation sheet writes this whole chain as one line:
Reading it left to right shows that comes straight out of the impulse-momentum theorem (below): divide by , and if the mass stays the same, the only way momentum can change is through velocity, so and . AP Physics 1 doesn’t ask you to calculate anything for a system whose mass changes over time (like a rocket burning fuel), so on the exam you’ll always be in this constant-mass case.
Defining Impulse
Impulse is the product of the average force on an object and the time interval it acts over.
where is impulse (a vector), is average force in Newtons, and is the time interval in seconds. The units are Newton-seconds (N·s), which is equivalent to kg·m/s.
Impulse is a vector, pointing in the same direction as the net force, which matters a lot in “rebound” scenarios.
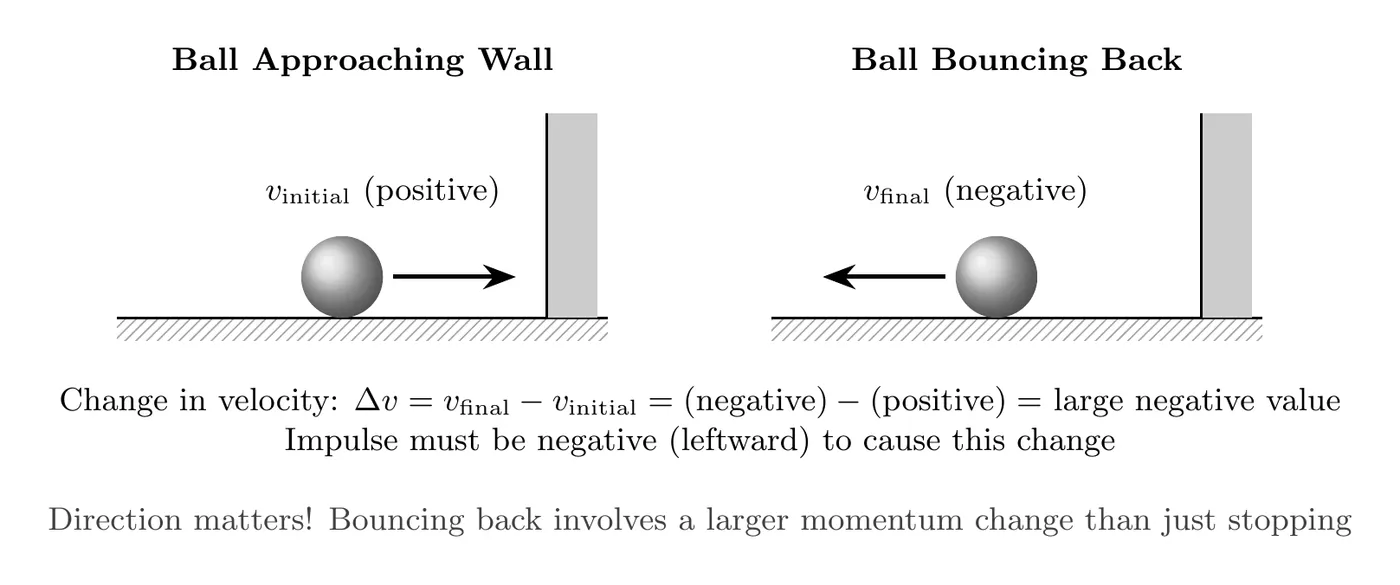
Example: a ball approaches a wall moving right at +5 m/s, giving initial momentum . It bounces back moving left at -4 m/s, giving final momentum . The change in momentum is:
That’s a bigger momentum change than if the ball had simply stopped (which would only be ). Rebounds produce larger impulses than stops, because the velocity change includes both stopping and reversing direction.
Impulse as Area Under a Force vs. Time Graph
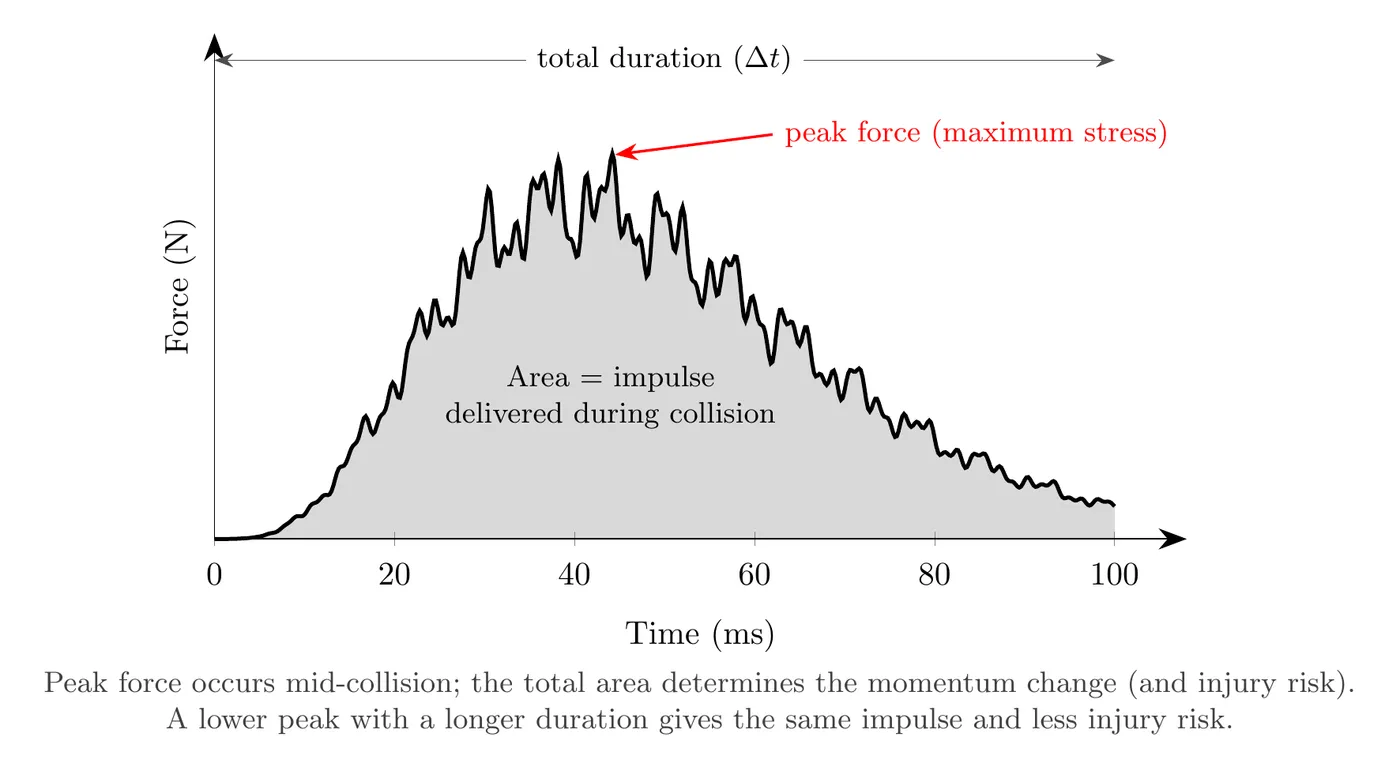
Graphically, impulse equals the area under a Force vs. Time curve.
For a constant force, this is a simple rectangle, . For a varying force, you need the geometric area (triangles, trapezoids) or integration.
Real-world application, crash test data: graphs of acceleration vs. time from crash tests, like readings from a head during impact, can be converted to force by multiplying by mass, . The area under that force vs. time curve is the delivered impulse. This calculation leads to the Head Injury Criterion (HIC) score, used in automotive safety ratings to evaluate airbag effectiveness, crumple zone design, and seatbelt systems, lower HIC scores mean safer vehicles.
Net Force as the Slope of a Momentum vs. Time Graph
Since , the net external force on a system is the slope of its momentum vs. time graph, just like velocity is the slope of a position vs. time graph. A steep slope means a large net force, a flat section means zero net force (momentum isn’t changing), and a downward slope means the net force points in the negative direction. The units check out: (kg·m/s)/s = kg·m/s² = N. If the graph is curved, the slope of the tangent line at a point gives the net force at that instant.
So the two graphs work as a pair: the area under a force vs. time graph gives the change in momentum, and the slope of a momentum vs. time graph gives the net force.
Example: the graph shows the momentum of a 2.0 kg cart on a track. Find the net force on the cart during each interval and describe the cart’s motion.
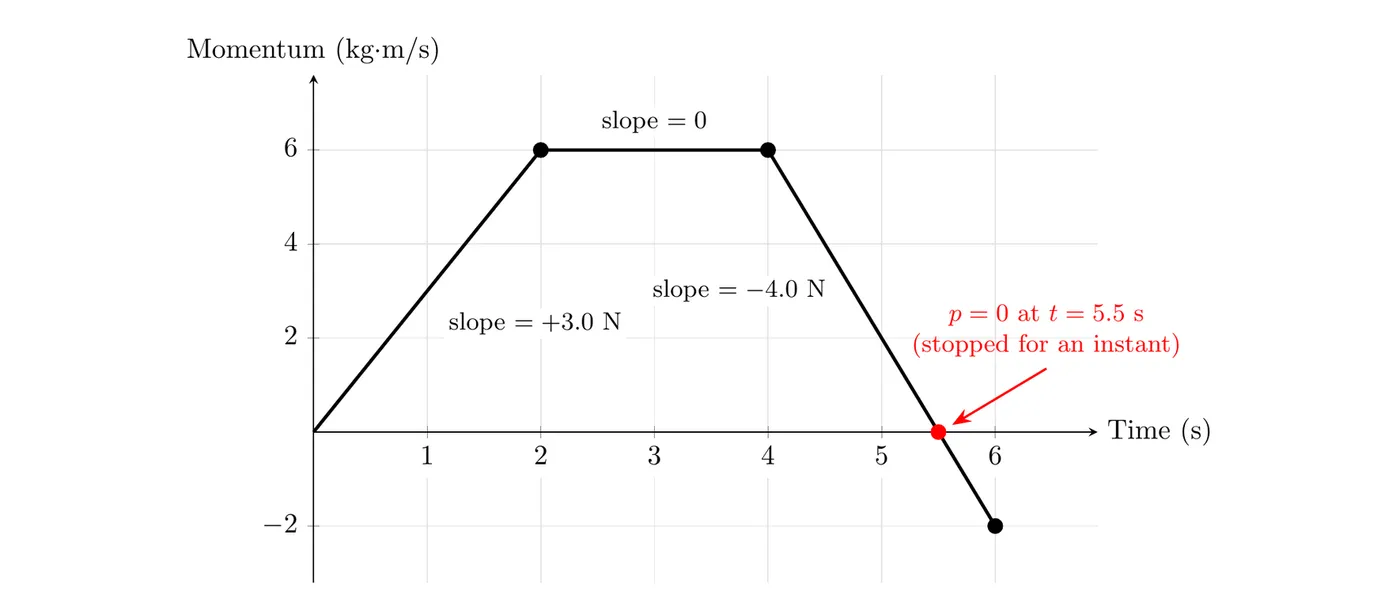
0 to 2.0 s: N. The cart speeds up in the positive direction.
2.0 to 4.0 s: the graph is flat, so . The cart coasts at a constant m/s.
4.0 to 6.0 s: N. The force stays the same the whole time, even though the cart slows down, stops for an instant at s (where ), and then speeds up backward. At s it moves at m/s, opposite its original direction.
Change in Momentum
The change in momentum is simply final minus initial momentum:
According to Newton’s Second Law in momentum form, , so rearranging gives . This is the foundation of the impulse-momentum theorem.
The Impulse-Momentum Theorem
Impulse-Momentum Theorem: the impulse delivered to an object equals the change in its momentum.
Expanded forms include , , and .
Deriving it: starting from , multiply both sides by to get . Since the left side is exactly the definition of impulse, , this becomes , the impulse-momentum theorem.
This gives us two equivalent statements: impulse equals change in momentum, ; and area under an F-t graph equals change in momentum, . Same idea, one algebraic, one graphical.
Worked Example: Tennis Ball Rebound
A 0.058 kg tennis ball hits a wall at 25 m/s and bounces straight back at 19 m/s. The ball touches the wall for 4.0 ms. Find the impulse on the ball and the average force the wall exerts on it.
Setup: take the direction toward the wall as positive, so m/s and m/s. Convert the time to seconds: s.
Impulse: by the impulse-momentum theorem, the impulse equals the change in momentum.
The negative sign means the impulse points away from the wall, the same direction as the wall’s force on the ball.
Average force:
The wall pushes on the ball with an average force of about 640 N, directed away from the wall. (Keep the unrounded until the last step, then round to two significant figures to match the data.)
Same answer from : the ball’s acceleration is m/s², so N. That’s Newton’s second law coming straight out of the impulse-momentum theorem, since the ball’s mass doesn’t change.
Compare with stopping: if the ball had stopped dead in the same 4.0 ms, kg·m/s and N. Bouncing back takes about 1.8 times as much force, because the wall has to stop the ball and send it back the other way.
Applications: Safety Technology
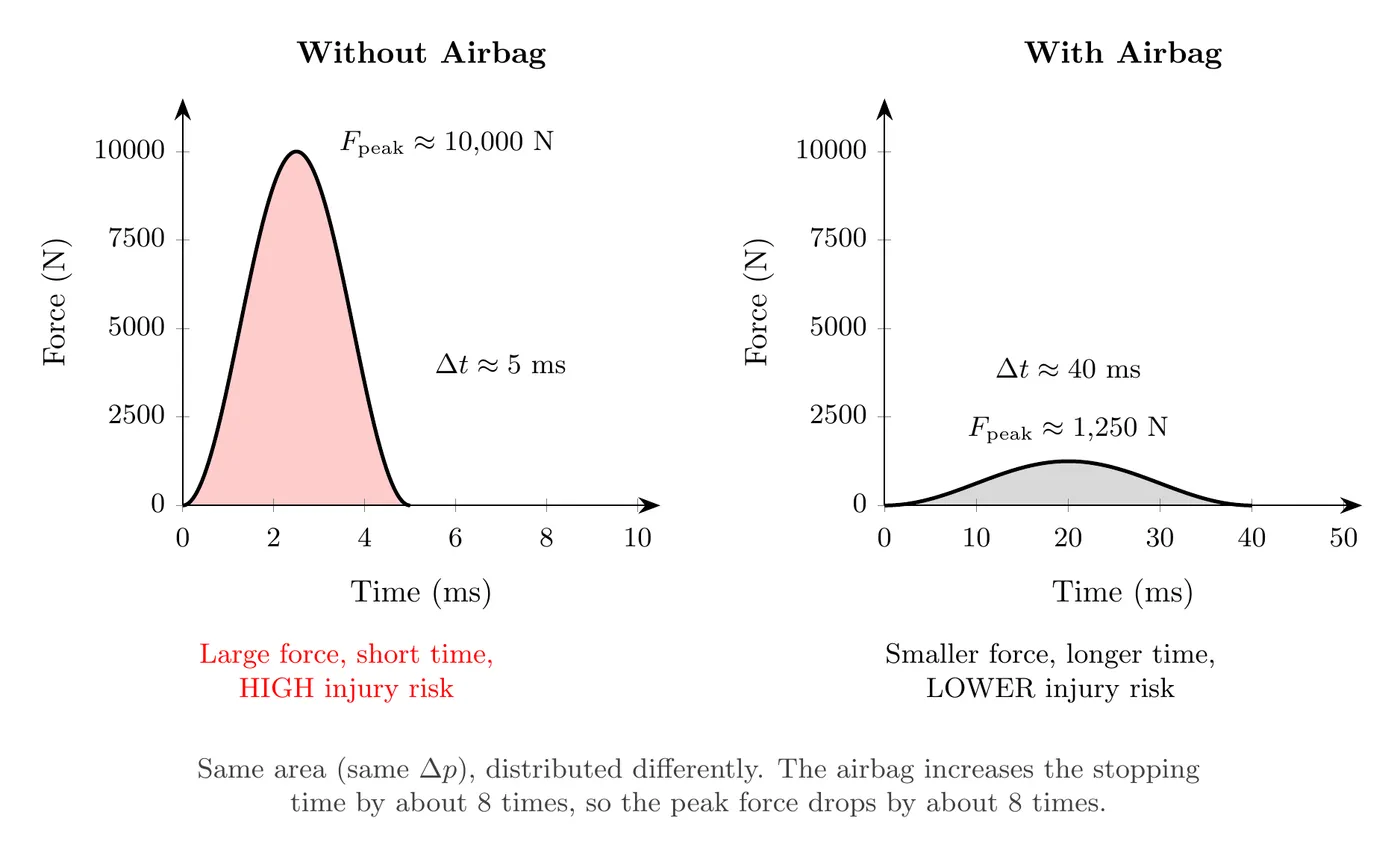
The impulse-momentum theorem explains why certain safety features work. In a collision, the momentum change is fixed, determined by initial and final velocities, so the impulse is fixed too:
Force and time are inversely related, since . Since we can’t change , the momentum change has to happen, the strategy becomes increasing to decrease . Lower forces mean less injury.
Airbags: without one, a head stops in roughly 5 ms, a very short time, resulting in a high average force and high injury risk. With one, the head stops in roughly 30 to 50 ms, a longer time, resulting in lower average force and reduced injury risk. Same momentum change, lower peak force.
Crumple zones: modern cars have sections designed to deform during a crash, increasing collision time. The car body crumples gradually instead of stopping rigidly, extending stopping time from about 0.05 s to about 0.15 s, and reducing force by roughly a factor of 3. The trade-off: the car is destroyed, but passengers are safer because the car absorbs energy through deformation.
Helmet technology: sports helmets use foam padding to increase impact time. The hard shell spreads force over a larger area, the foam compresses during impact to extend the time, and together they reduce peak force on the skull. Modern designs use multi-density foam and systems like MIPS (Multi-directional Impact Protection System) to reduce rotational forces too.
Seatbelts: without one, your body keeps moving forward at the vehicle’s initial speed and strikes the dashboard or windshield in about 10 ms, producing extremely high forces. With one, the belt restrains your body while stretching slightly, extending stopping time to roughly 50 to 100 ms and reducing force by a factor of 5 to 10. Combining a seatbelt with an airbag gives the maximum time extension and force reduction.
The Force-Time Relationship
From the impulse-momentum theorem, for a given collision, so , an inverse relationship, . Double the time and you halve the force, triple the time and you get a third of the force, ten times the time gives a tenth of the force. This is exactly why safety devices work, they don’t change the impulse, they redistribute it over a longer time to reduce the peak force.
Worked Example: Force-Time Graph and Final Velocity
A 2 kg ball starts at rest. A time-varying force acts on it, shown as a triangular Force vs. Time graph: force starts at 0 N at , increases linearly to 10 N at s. Find the ball’s velocity after 8 seconds.
Calculating impulse (area of the triangle):
The force delivers 40 N·s of impulse to the ball over 8 seconds.
Applying the impulse-momentum theorem: . Since the ball starts at rest, , so kg·m/s.
Finding final velocity: m/s.
After 8 seconds of the time-varying force, the ball moves at 20 m/s.
Checking with average force: N, half the peak force (10 N), which always holds for a triangular force profile. Using this directly, m/s, matching what we found before.
Worked Example: Positive and Negative Area
A 0.50 kg cart moves at +1.0 m/s along a level track. The graph shows the net force on the cart from to s. Find the cart’s velocity at s and at s.
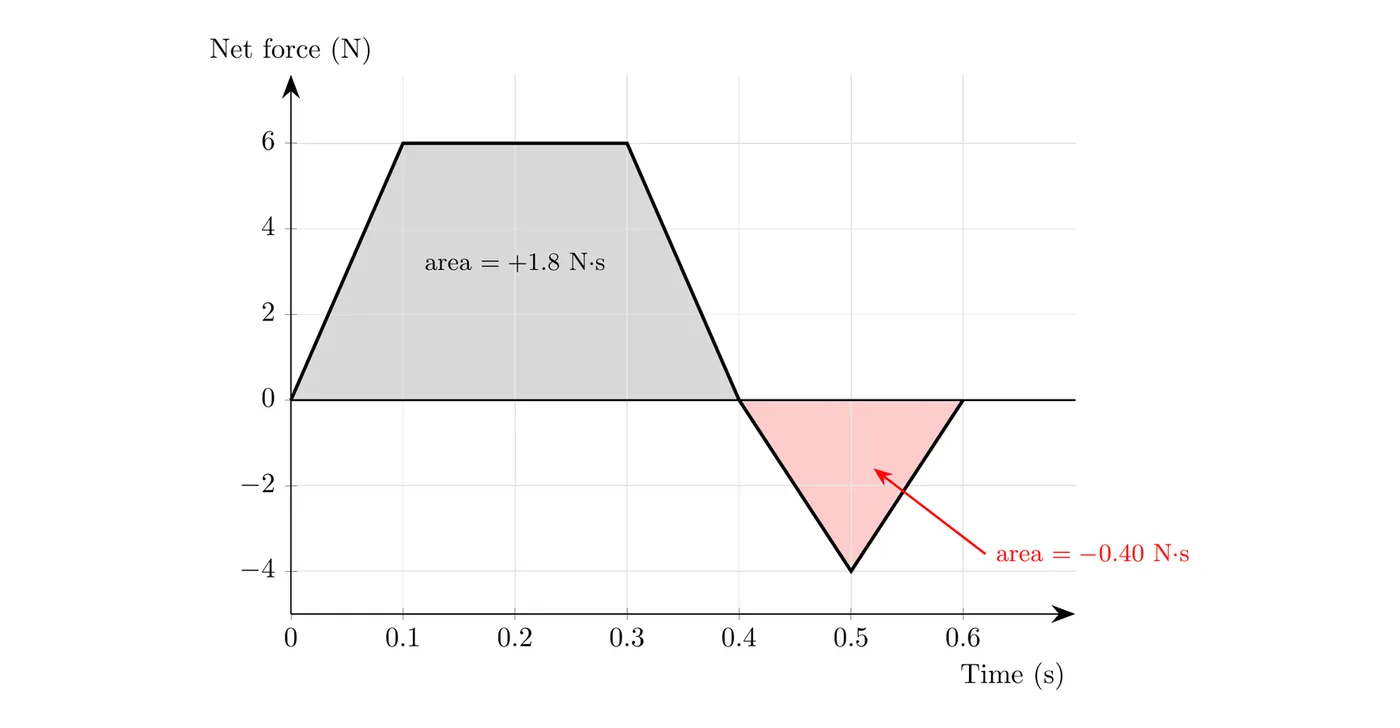
Positive area (0 to 0.40 s): the shape is a trapezoid with parallel sides of 0.40 s (along the axis) and 0.20 s (along the top), and a height of 6.0 N:
Negative area (0.40 to 0.60 s): a triangle below the axis with a base of 0.20 s and a height of 4.0 N, so it counts as negative impulse:
Velocity at 0.40 s: m/s, so m/s.
Velocity at 0.60 s: the net impulse is N·s, so m/s and m/s.
The cart is fastest at s, right when the force switches direction. As long as the force is positive the cart keeps speeding up (even from 0.30 to 0.40 s, while the force is shrinking), and once the force turns negative the cart starts slowing down. The impulse always points the same way as the net force, which is why the area below the axis subtracts.
Units and Dimensional Analysis
This is equivalent to momentum units: , which makes sense since impulse equals a change in momentum, so they have to share units. Both N·s (emphasizing force times time) and kg·m/s (emphasizing the momentum change) are acceptable.
Comparing Impulse-Momentum and Work-Energy
Both theorems connect a “cause” to an “effect,” just for different quantities.
Impulse-Momentum Theorem | Work-Energy Theorem |
Force times time | Force times distance |
Changes momentum (vector) | Changes kinetic energy (scalar) |
Direction matters | Direction doesn’t matter |
Useful for collisions | Useful for energy transformations |
Use impulse-momentum when time is known, or when analyzing collisions or explosions. Use work-energy when distance is known, or when analyzing energy conversions.
Common Scenarios
Stopping a moving object: given mass, initial velocity, and stopping time, find the average force with .
Area under an F-t graph: given a force vs. time graph, find the final velocity (with known initial velocity and mass) by calculating the area under the curve (impulse), then using to find the velocity change.
Comparing safety devices: given the same momentum change but different times, find which has the lower force (safer): , so a longer time means a smaller force, which means safer.
Common Mistakes
Forgetting the vector nature: don’t treat impulse or momentum change as always positive, include direction (sign) based on your coordinate system.
Confusing impulse and momentum: don’t say “the object has 50 N·s of momentum,” instead say “the object received 50 N·s of impulse” or “the object has 50 kg·m/s of momentum.”
Area calculation errors: don’t count area above and below the time axis with the same sign, areas below the axis are negative (force in the opposite direction).
Using peak force instead of average: don’t write when force varies, use or find the actual area under the curve.
Mixing up area and slope: on a force vs. time graph, the area is the impulse (the change in momentum). On a momentum vs. time graph, the slope is the net force. Read the axis labels before you start.