

2.3 - Market Research
Why Businesses Conduct Market Research
Market research means gathering detailed information about markets, products, and customer behavior in order to guide marketing decisions. Businesses collect two broad types of data. Quantitative data is numerical and measurable, the kind of thing you can run statistics on, and it answers questions like how many, how much, or how often. Qualitative data is descriptive and non-numerical, made up of words or images, and it answers questions like why or how.
For example, a survey might find that 62% of customers would try a new flavor and that they'd pay about $3 for it. That's quantitative data. Interviews with a few of those customers might reveal that they like the taste but find the packaging hard to open. That's qualitative data. Quantitative data shows what is happening and how much, and qualitative data helps explain why.
When it comes to new products, businesses use research to judge three things. Is the product desirable, meaning does it create value and achieve problem-solution fit by actually solving something customers care about? Is it feasible, meaning does the business actually have the resources, technology, expertise, and time to produce and deliver it? And is it viable, meaning does it have real potential to be profitable? Research helps businesses avoid pouring resources into products that just won't work.
A product needs all three to be worth launching. Take an idea for a phone case with a built-in battery. It's desirable if students actually want it (research might show that many students' phones die before the school day ends). It's feasible if the business can get batteries and make the cases safely, at the needed quality, with the money, skills, and time it has. It's viable if it can sell enough cases at a price above what each one costs to make and deliver. A product customers love that costs too much to make fails the viability test, and a cheap, easy product nobody wants fails the desirability test.
For products already on the market, businesses use research to keep up with changing customer needs and wants, spot opportunities for innovation like new features or versions, and build strategies to retain or grow market share.
For example, a cereal brand that sees sales slipping might survey its customers and learn that many parents now want less sugar. That could lead to a new low-sugar version (product innovation) and ads aimed at health-conscious parents (a strategy to keep its market share).
Secondary-Source Research
Businesses rely on two broad types of research: primary-source research, where they collect the data themselves, and secondary-source research, where they use data someone else already collected. Both help businesses understand customers, competitors, the overall market, and relevant PESTEL factors.
Secondary-source research means pulling quantitative or qualitative information from outside sources, like government publications and databases, commercial industry reports, or academic studies. These sources often reveal market size (in dollars and number of customers), market trends, market segments, and what factors influence customer decisions. This kind of information helps a business gauge whether a product idea might actually be viable, and it's a much more cost-effective way to assess the market landscape than running large original studies from scratch.
Common secondary sources include U.S. Census Bureau data (population, age, and income by area), Bureau of Labor Statistics data (what households spend money on), industry reports from research firms and trade associations, news articles, and rivals' own websites, prices, reviews, and annual reports. This is also how a business learns about its rivals: what they sell, what they charge, where they're located, and what customers say about them.
Secondary data can also be used to estimate market size. Suppose a business wants to open a dog-grooming service in a town. Census data shows the town has 40,000 households, and suppose an industry report says about 40% of households own a dog. That's about 40,000 × 0.40 = 16,000 potential customers. If the average dog-owning household spends $200 a year on grooming, the market is worth about 16,000 × $200 = $3.2 million a year. If three rival groomers already serve most of that market, the opportunity may be smaller than it first looks.
The downside is that secondary data wasn't collected to answer this business's exact question. It may be out of date, too general (national numbers for a local business), or just as available to every rival. That's why businesses usually follow up with their own primary research.
Primary-Source Research and Hypothesis Testing
To actually test their assumptions about customers and preferences, businesses run their own primary research using surveys, A/B testing, focus groups, interviews, experiments, or observation.
A business hypothesis is simply a stated assumption about a customer, product, or market, something like "teenagers prefer subscription pricing over a one-time purchase for this app." Businesses typically test hypotheses like this before committing significant resources to a decision.
Testing a hypothesis usually goes like this: state the hypothesis, choose a research method that produces the right kind of data, collect the data, interpret the results, and then decide whether to keep, change, or drop the plan. For the app example, the business might survey 400 teens in its target market and ask which pricing option they'd choose. If 70% pick the subscription, the data supports the hypothesis. If only 30% do, the business should rethink its pricing before launch. It could also run an A/B test, showing half of its website visitors a subscription price and the other half a one-time price, and compare how many actually sign up or buy.
Which method a business chooses depends on what kind of data it needs. Surveys work best when a business needs a large amount of quantitative data that reflects a broader population's views. Focus groups and one-on-one interviews are better suited for in-depth qualitative data from a smaller number of people, since they allow follow-up questions and detailed reasoning, often from highly engaged customers. Experiments and observations are the way to go when a business needs data on actual behavior rather than just opinions: experiments create a controlled environment to test how changes affect behavior, while observations involve watching behavior in a natural setting, like a store, website, or app, without interfering. A/B testing is a specific kind of experiment that compares authentic customer responses to two viable alternatives, often used in real-world settings like two versions of a webpage or email, to measure specific preferences in practice.
To avoid skewed results, businesses design their research using sufficiently large samples, samples that actually represent the target population, and neutrally worded questions that don't steer people toward a particular answer.
Here's what skewed research looks like. Asking 10 friends whether they'd buy a product is too small a sample, and friends tend to say yes to be nice. Surveying only people at a gym about a snack meant for all teenagers leaves out most of the target market, so the sample doesn't represent the population. And a leading question like "Wouldn't you love our delicious new flavor?" pushes people toward yes. A neutral version would be "How would you rate this flavor on a scale of 1 to 5?"
Even with solid research, though, businesses can't always predict exactly how customers or markets will respond. They often still have to innovate, adjust, and make decisions with data that's limited, unclear, or even conflicting.
Data Visualizations for Market Research Findings
Businesses use data visualization to spot patterns and trends, communicate insights clearly, and support decisions backed by evidence. The most common tools are bar charts, stacked bar charts, line graphs, and pie charts, and which one a business picks depends on the kind of pattern or relationship it's trying to show.
Bar charts are best for comparing individual data points, like comparing several years of sales for one business, or comparing annual revenue across several businesses in a market.
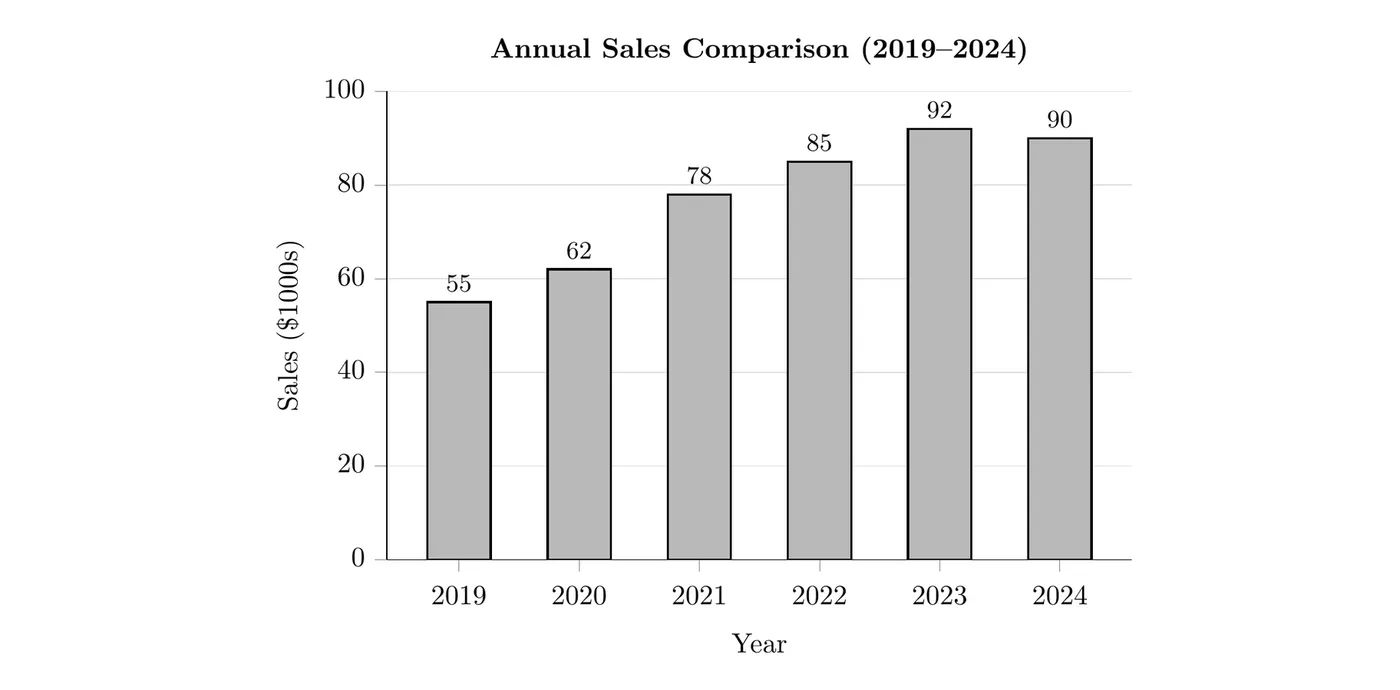
Reading this chart: sales grew every year from $55,000 in 2019 to a peak of $92,000 in 2023, then dipped slightly to $90,000 in 2024. The biggest one-year jump was from 2020 to 2021, when sales rose from $62,000 to $78,000 (an increase of $16,000). A business would want to find out what caused that jump and why sales slipped in 2024.
Stacked bar charts show totals and subcategories at the same time, for example one bar per year that shows total sales, broken down by how those sales split across different product lines.
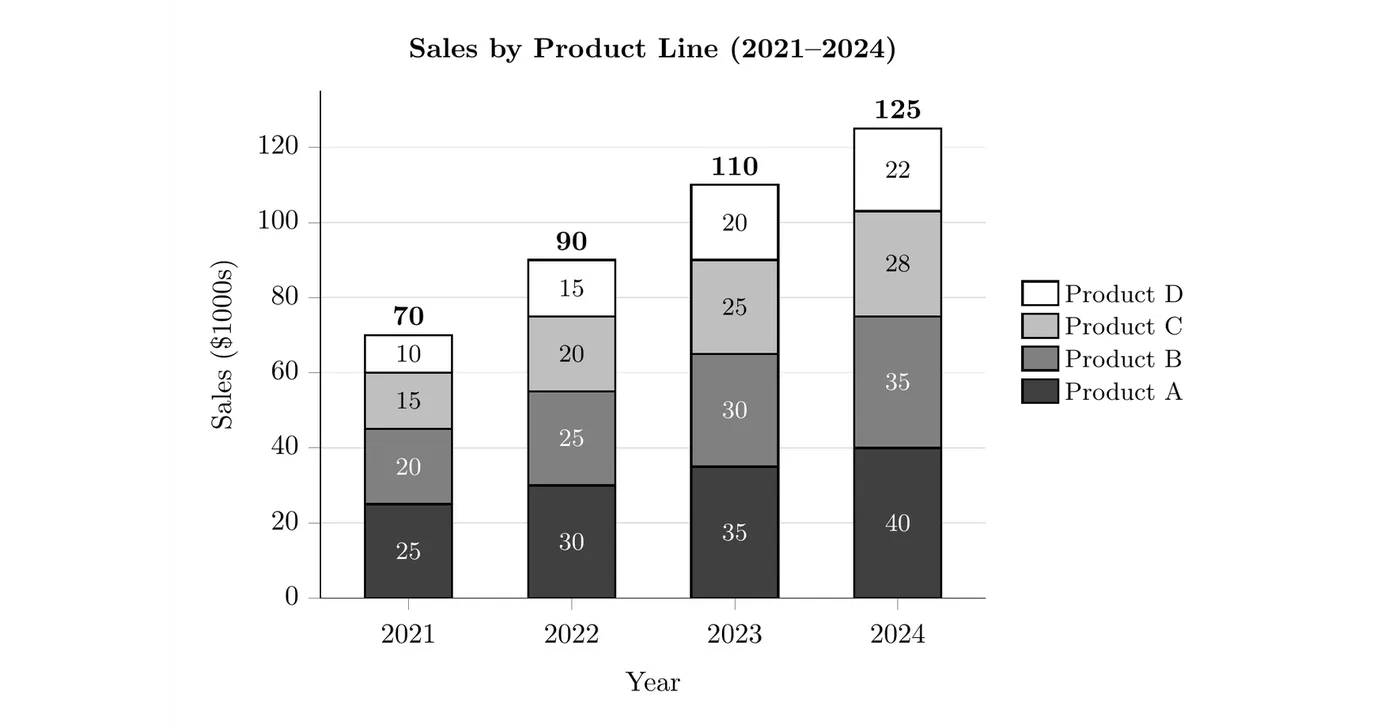
Reading this chart: total sales rose every year, from $70,000 in 2021 to $125,000 in 2024, and every product line grew too. Product A was the biggest line each year ($25,000 to $40,000). Product D was the smallest, but it grew the fastest in percentage terms, more than doubling from $10,000 to $22,000 (a 120% increase). A plain bar chart of the totals would hide that detail.
Line graphs are the go-to for showing trends over time, like the number of customers per year or website visits per month.
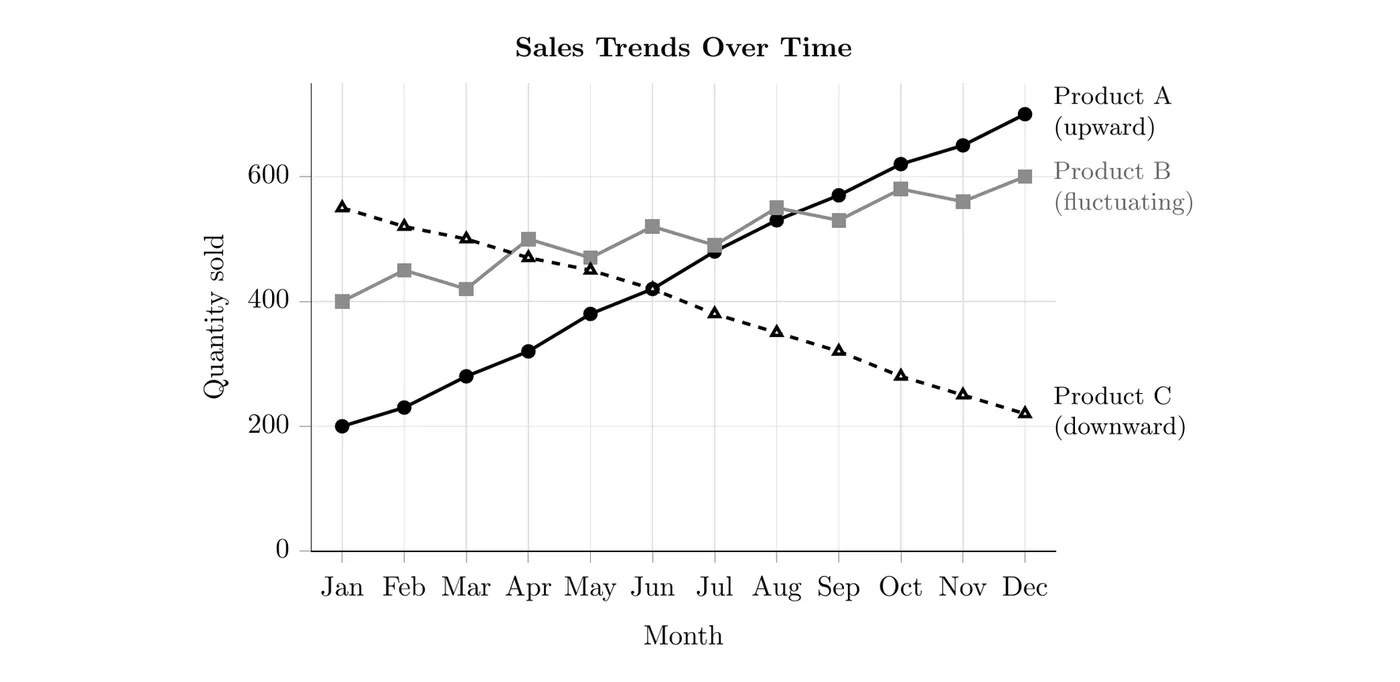
Reading this graph: Product A's sales rose steadily, from 200 units in January to 700 in December. Product B went up and down from month to month but trended upward overall, from 400 to 600 units. Product C fell steadily, from 550 units to 220. Product A caught up with Product C in June and passed Product B in September. A business seeing this might put more resources behind Product A and check whether Product C is entering the decline stage of its life cycle (see 2.4).
Pie charts show part-to-whole relationships, meaning how a total is divided among categories, like the percentage of market share held by each business in a market.
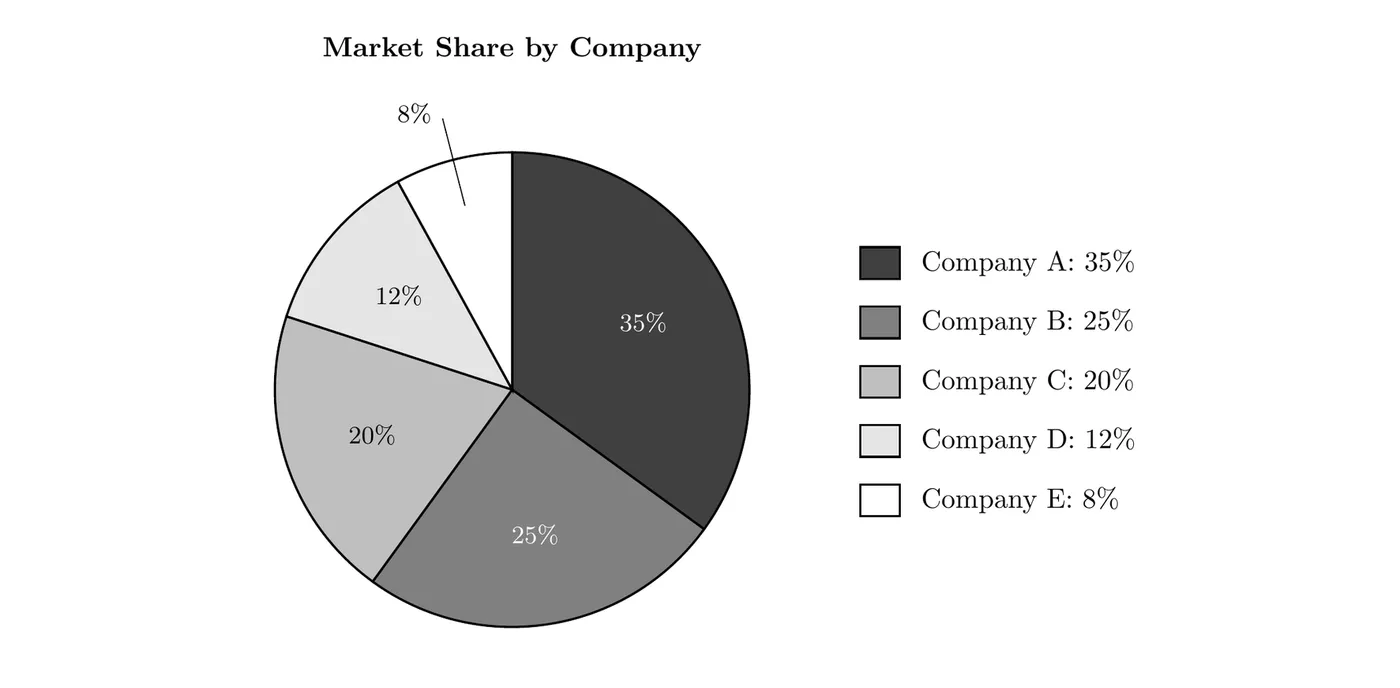
Reading this chart: the five slices add up to 100% of the market. Company A is the market leader with 35%, and the top two companies together hold 60%. (1.2 shows how to calculate market share.)
When developing your own data visualization, give it a clear title, label each axis with what it measures and its units (like "Sales ($1000s)" or "Year"), include a legend when more than one category is shown, start the value axis of a bar chart at zero so differences aren't exaggerated, and make sure the slices of a pie chart add up to 100%.