

5.3 - Linear Regression Models
Overview
When a scatterplot shows a linear form, you can summarize the pattern with a line and use it to make predictions. That line is a linear regression model. This topic covers the equation , how to use it to predict a response, and when a prediction can be trusted (interpolation) or can't (extrapolation).
When a linear model makes sense
If the form of the relationship between and appears linear, you can approximate it with a linear regression model: a linear equation that uses the explanatory variable to predict the response variable .
So check the form first (Topic 5.1). A line fit to a curved pattern is wrong in a predictable way, too high in some places and too low in others. Topic 5.4 shows how to check this with residuals. And remember that a model describes the overall trend. Real data points scatter around it.
The regression equation
A linear regression model has the form
- ("y-hat") is the predicted value of the response variable.
- is the -intercept: the predicted value of when .
- is the slope of the regression line: how much the predicted changes for each 1-unit increase in .
- is the value of the explanatory variable.
This is the only regression formula on the AP formula sheet. Notice the order: AP Statistics writes the intercept first (), unlike in algebra. On the TI-84, use LinReg(a+bx) so the letters match.
The hat matters. is an actual observed value, while is a prediction. Writing without the hat claims every car's price falls exactly on the line, and AP graders take credit off for it. In context, use the variable names:
or write "predicted price = 29.0 - 1.80(age)" and say what each variable and its units are.
Calculating a predicted response
To predict, substitute the -value into the equation and calculate . Then say what it means in context, with units.
Example 1: Predicting a car's price
For the 10 used cars from Topic 5.1, the regression model is , where is age in years and is the predicted price in thousands of dollars. (Topic 5.5 shows how technology finds this line.) Predict the price of a car that is 8 years old.
Answer: The model predicts that an 8-year-old car of this model is listed for about $14,600. On the graph, go up from to the line, then across to the vertical axis.
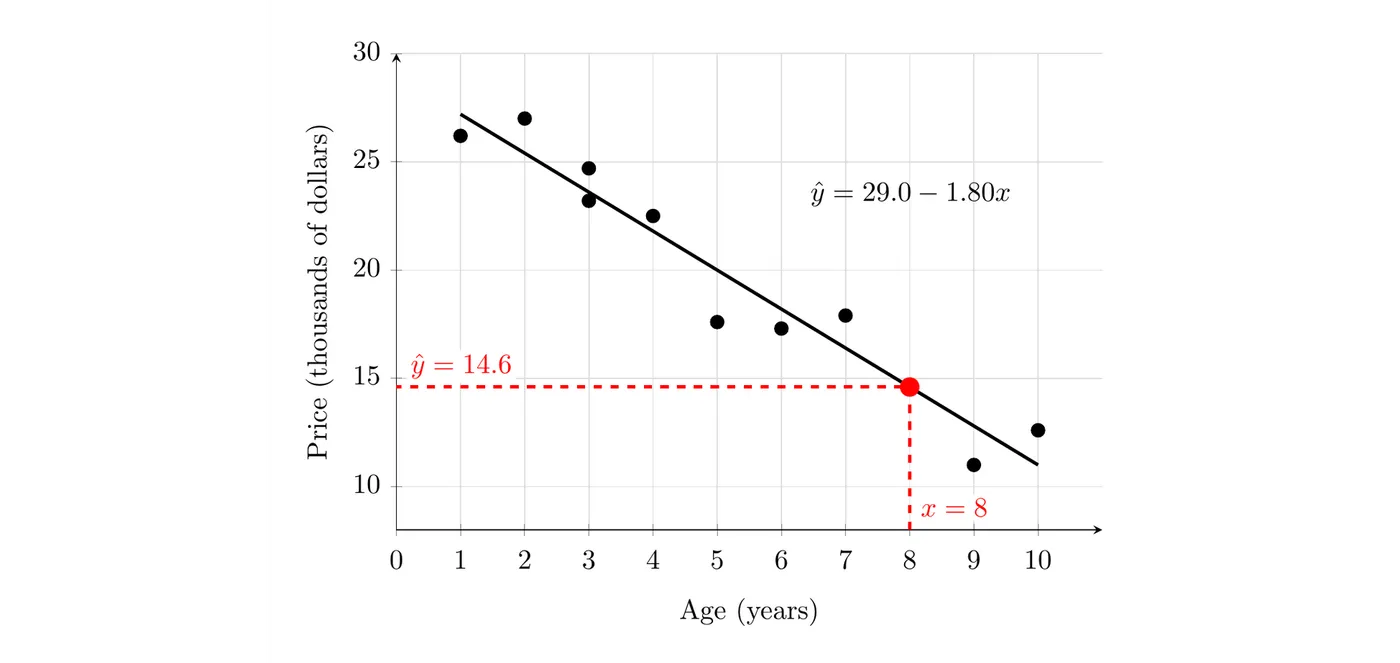
None of the 10 cars is exactly 8 years old, but 8 is between the youngest car (1 year) and the oldest (10 years). That makes this an interpolation, which is the next idea.
Interpolation and extrapolation
- Interpolation is predicting a response using a value of the explanatory variable that is within the interval of -values used to find the regression line.
- Extrapolation is predicting a response using a value of the explanatory variable that is beyond that interval. The further you extrapolate, the less reliable the prediction is.
Why is extrapolation risky? The data only show the pattern over the -values you actually observed. Nothing guarantees that the linear pattern continues past them. For the cars, the data cover ages 1 to 10 years. A prediction for a 25-year-old car is an extrapolation, and it comes out absurd:
A price of thousand dollars makes no sense. A price can't drop below 0, so the real pattern has to level off somewhere past the data, and the line can't follow it there.
Example 2: Crickets and temperature
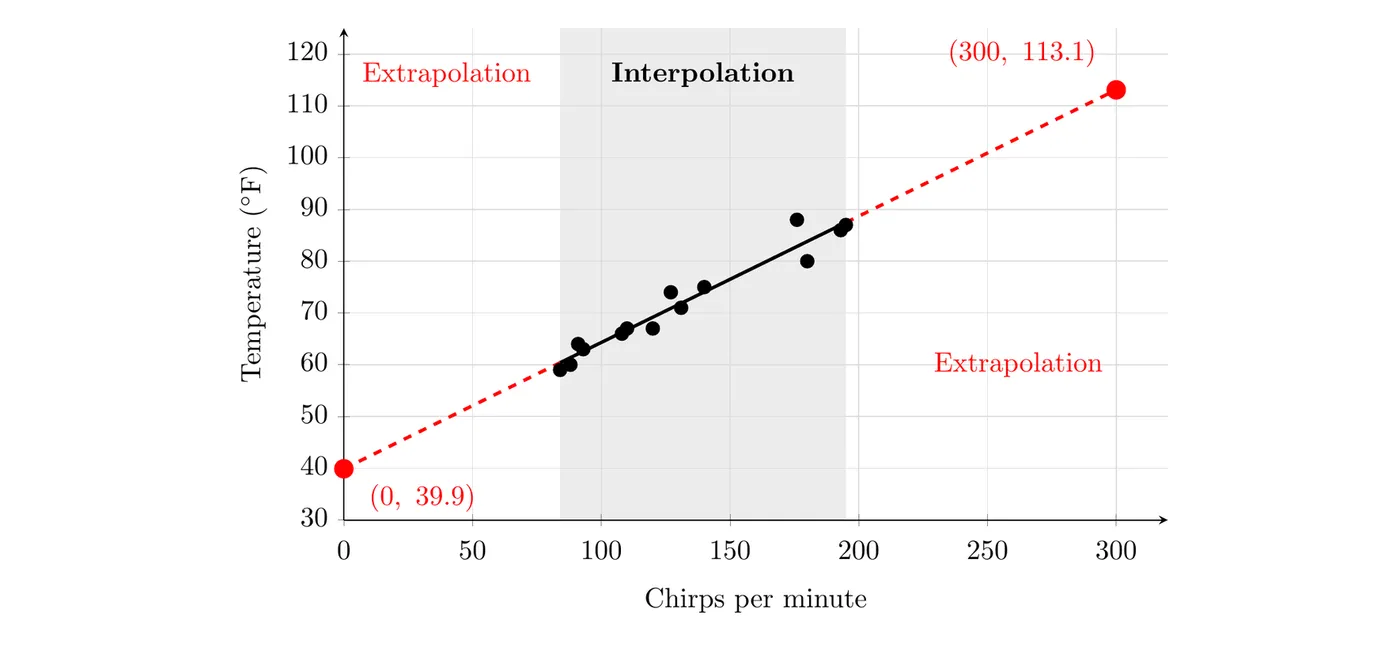
Crickets chirp faster when it's warmer. Suppose a student recorded the chirps per minute of crickets and the air temperature (°F) on 14 evenings. The chirp rates ranged from 84 to 195 chirps per minute, and the scatterplot showed a strong linear pattern. The regression model is , where is chirps per minute and is the predicted temperature in °F.
(a) Predict the temperature when crickets chirp 160 times per minute.
The model predicts about 78.9°F. This is interpolation (160 is between 84 and 195), so the prediction is reasonable.
(b) What does the model predict for 300 chirps per minute? Should you trust it?
The model predicts 113.1°F, but this is an extrapolation far past the largest chirp rate in the data (195). We have no data there, and crickets may never chirp that fast. Don't trust it.
(c) What does the model predict for 0 chirps per minute?
°F. This is also an extrapolation, well below 84 chirps per minute. Crickets stop chirping when it gets cold, so 0 chirps could happen at many different temperatures. The prediction is unreliable.
Example 3: Growing children (AP-style)
Suppose a pediatrician used data on children ages 3 to 10 to get the model , where is age in years and is predicted height in inches. Use the model to predict the height of a 30-year-old, and explain whether the prediction is reasonable.
Answer: The model predicts 103.5 inches, about 8.6 feet. That's not reasonable. Age 30 is far outside the ages used to build the model (3 to 10 years), so this is an extrapolation. Children grow at a fairly steady rate, but growth stops in the late teens, so the linear pattern doesn't continue to age 30.
Common mistakes
- Leaving off the hat or not defining the variables. Write (or "predicted ___") and say what and stand for, with units.
- Mixing up and . In , stands alone and multiplies .
- Trusting an extrapolation. Before predicting, check whether the -value is inside the range of the data.
- Fitting a line without checking the form. Look at the scatterplot first.
- Reporting a bare number. A prediction needs units and context: "about $14,600 for an 8-year-old car," not "14.6."