

5.1 - Graphical Representations Between Two Quantitative Variables
Overview
Units 1 through 4 mostly looked at one variable at a time. Unit 5 looks at how two quantitative variables relate, like a car's age and its price. The main tool is the scatterplot, and the main skill is describing what it shows in context: the form, direction, and strength of the association, plus anything unusual. Everything else in this unit (correlation, regression lines, residuals) builds on reading a scatterplot well.
Bivariate quantitative data
A bivariate quantitative data set is made of ordered pairs: two quantitative variables measured on the same individuals in a sample or population. Each individual gives one pair , and those pairs are what you plot in a scatterplot.
"Same individuals" is the key part. If you record the ages of 10 cars and the prices of 10 different cars, you can't pair them up. Each pair has to come from one car.
Here's a made-up data set we'll use all through Unit 5: the age and listed price of 10 used cars of the same make and model on a car-sales website.
Car | Age (years) | Price (thousands of dollars) |
1 | 1 | 26.2 |
2 | 2 | 27.0 |
3 | 3 | 23.2 |
4 | 3 | 24.7 |
5 | 4 | 22.5 |
6 | 5 | 17.6 |
7 | 6 | 17.3 |
8 | 7 | 17.9 |
9 | 9 | 11.0 |
10 | 10 | 12.6 |
Car 1 is the ordered pair : it's 1 year old and listed at $26,200. Cars 3 and 4 are both 3 years old, which is fine. Different individuals can share an -value.
Explanatory and response variables
When you use one variable to explain or predict the other, the two variables get different jobs and different axes:
- Explanatory variable (): the variable whose values are used to explain or predict the other variable. It goes on the horizontal axis.
- Response variable (): the variable being explained or predicted. It goes on the vertical axis.
For the cars, age is explanatory and price is the response, because we use a car's age to predict its price, not the other way around. A quick test: finish the sentence "I want to use ___ to predict ___." The first blank is .
"Explanatory" doesn't mean "causes." It only means "used to predict." Topic 5.2 comes back to this. When there's no natural choice (height and arm span, say), the question usually tells you which variable to predict.
Constructing a scatterplot
A scatterplot shows the relationship between two quantitative variables. Each individual is one dot: its -value sets the horizontal position, and its -value sets the vertical position.
- Decide which variable is explanatory () and which is the response ().
- Label both axes with the variable name and units.
- Choose a scale for each axis that covers the data with evenly spaced ticks. An axis doesn't have to start at 0, but the spacing has to be even.
- Plot one dot for each individual.
Example 1: Scatterplot of the used cars
Make a scatterplot of the car data in the table above.
Age is explanatory, so it goes on the horizontal axis from 0 to 10 years. Price is the response, so it goes on the vertical axis, covering about 10 to 30 thousand dollars. Then plot each car: , , and so on. The two 3-year-old cars sit one above the other at .
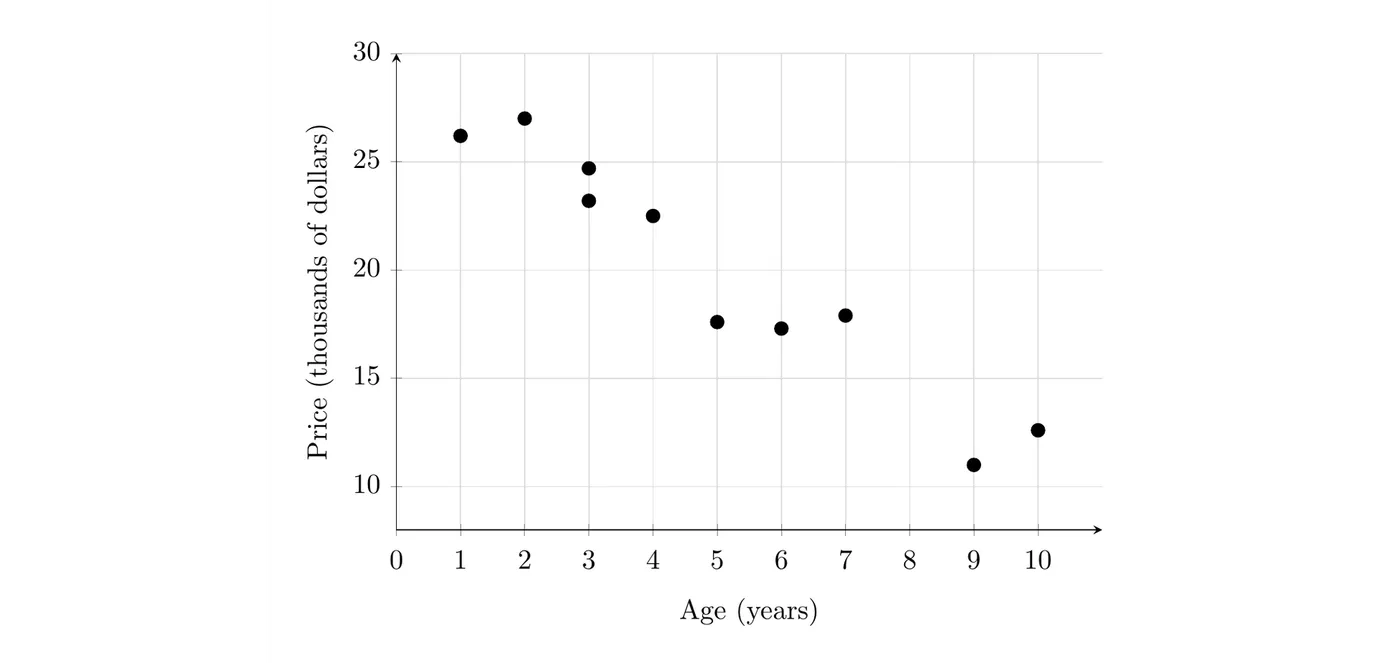
On the TI-84: enter the ages in L1 and the prices in L2 (STAT > 1:Edit). Press 2nd > Y= (STAT PLOT), turn Plot1 on, choose the first type (the scatterplot icon), and set Xlist to L1 and Ylist to L2. Then press ZOOM > 9:ZoomStat. If the exam asks you to draw one by hand, it still needs labeled, scaled axes.
Describing a scatterplot
A description of the association in a scatterplot includes four things: form, direction, strength, and unusual features. Describe all four, and describe them in context, using the variable names instead of "" and "." (Some students remember the four as DUFS: direction, unusual features, form, strength. Any order is fine as long as all four are there.)
Form
The form is the overall shape of the pattern. It's either linear (the points follow a straight-line pattern) or nonlinear (the points follow a curve or some other shape). To support "linear," point to the evidence, like "the pattern shows no curve," instead of just saying the points make a line.
Direction
The direction is positive or negative:
- Positive association: as values of the explanatory variable increase, values of the response variable tend to increase.
- Negative association: as values of the explanatory variable increase, values of the response variable tend to decrease.
"Tend to" matters. In a positive association, not every point is higher than the one before it. The overall trend goes up. Some scatterplots have no clear direction at all, and a curve that rises and then falls has no single direction.
Strength
The strength is how closely the points follow the general pattern. Describe it as strong, moderate, or weak. Points that hug the pattern tightly make a strong association; points spread loosely around it make a weak one.
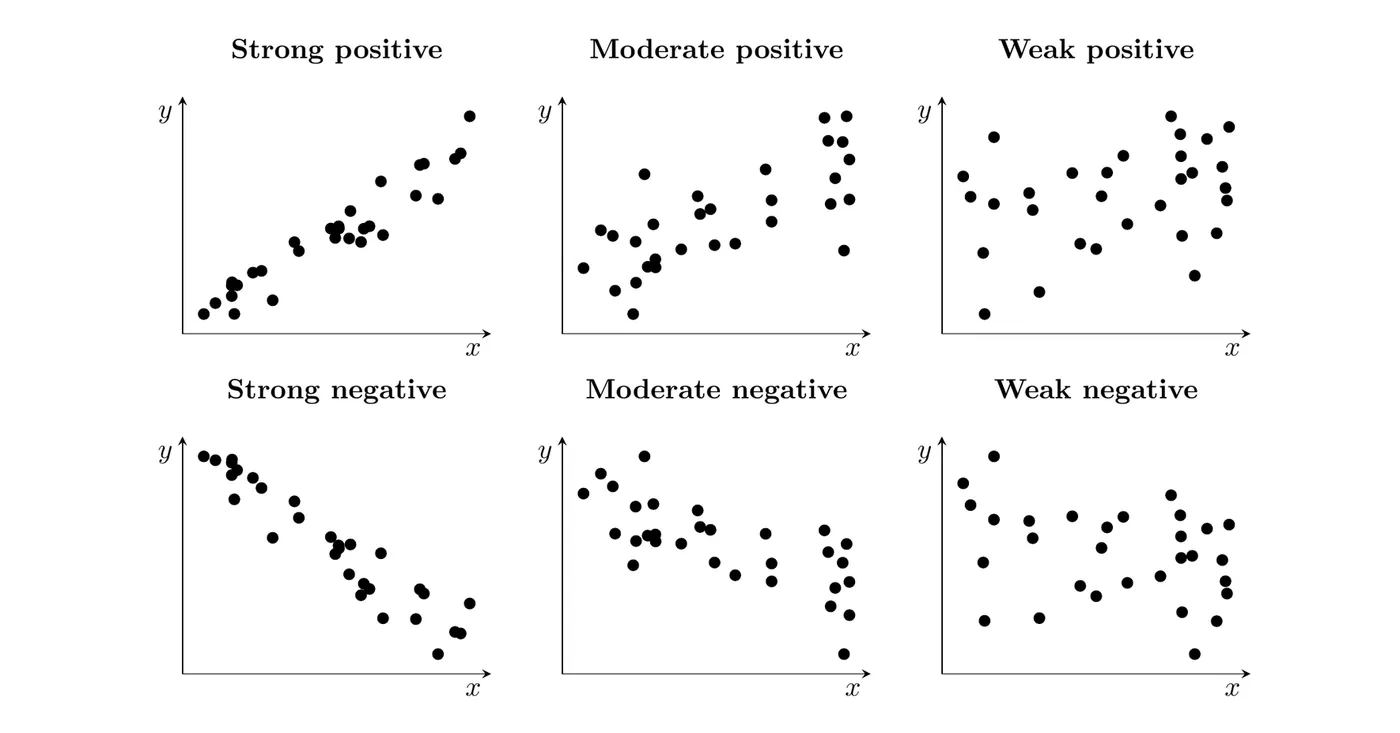
Unusual features
Unusual features are clusters (separate groups of points) and individual points that don't fit the general pattern of the rest (often called outliers). When you see one, name it and give its values in context.
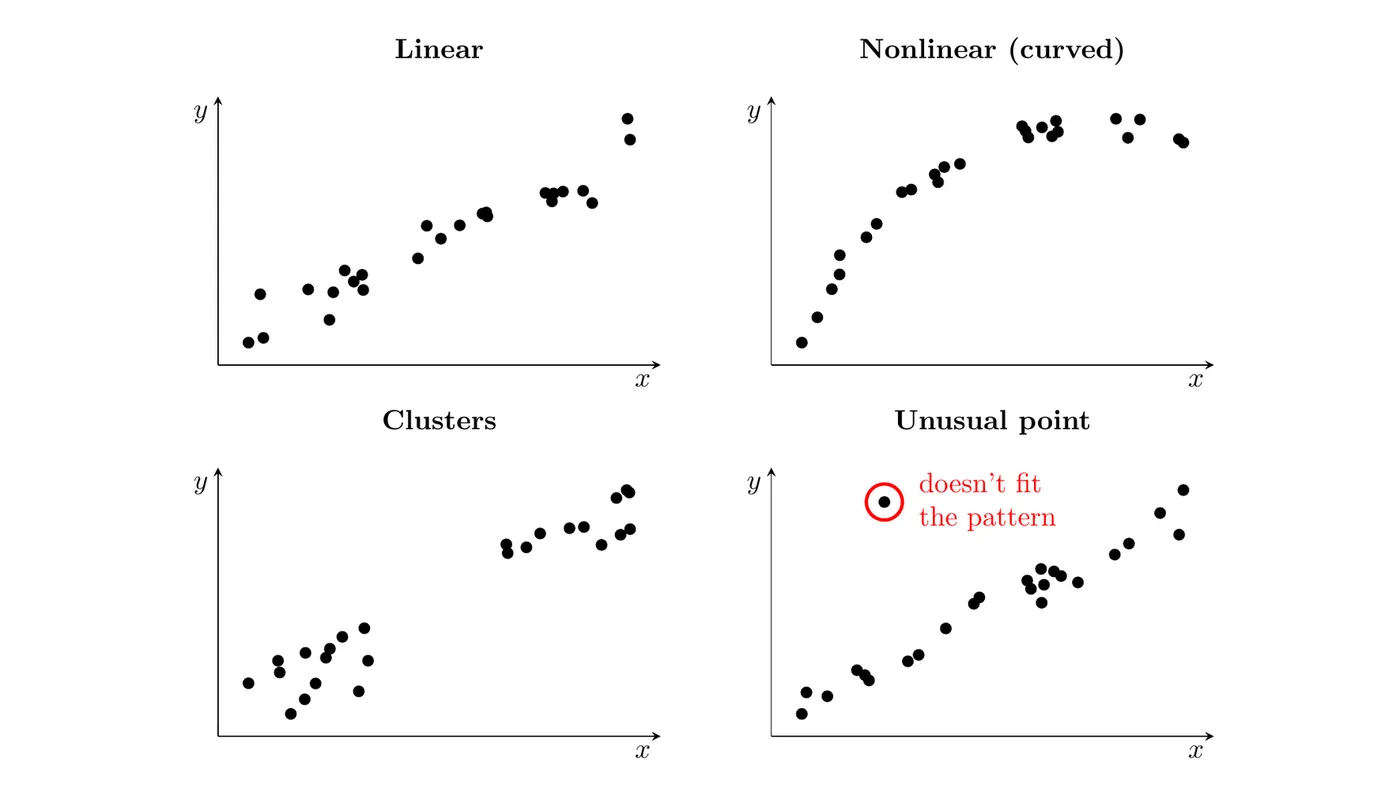
Feature | What to look for | Words to use |
Form | The overall shape of the pattern | linear, nonlinear (curved) |
Direction | Whether tends to rise or fall as increases | positive, negative |
Strength | How tightly the points follow the pattern | strong, moderate, weak |
Unusual features | Groups or points set apart from the rest | clusters, a point that doesn't fit the pattern |
Example 2: Describing a scatterplot (AP-style)
Suppose a nutritionist recorded the fat (grams) and calories of 12 sandwiches sold at a fast-food restaurant. Describe the association between fat and calories.
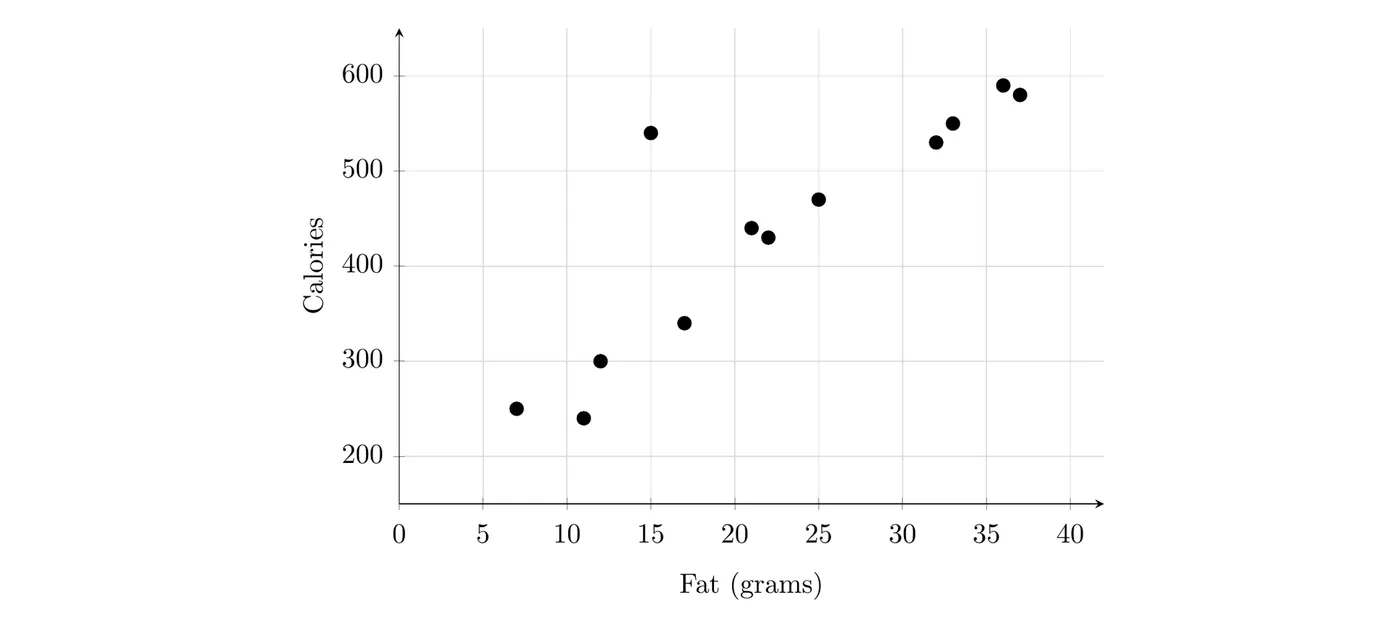
- Form: linear. Apart from one sandwich, the points follow a straight-line pattern with no curve.
- Direction: positive. Sandwiches with more fat tend to have more calories.
- Strength: strong. The points stay close to the linear pattern.
- Unusual features: one sandwich, with 15 grams of fat and 540 calories, has far more calories than the other sandwiches with similar fat. It doesn't fit the pattern.
Answer: There is a strong, positive, linear association between fat and calories for these 12 sandwiches: sandwiches with more fat tend to have more calories. One sandwich, with 15 grams of fat and 540 calories, doesn't fit the pattern because it has far more calories than other sandwiches with similar fat.
An answer like "strong and positive" with no variable names won't earn full credit. Graders look for all four features, in context.
Justifying a claim with a scatterplot
A scatterplot can be evidence for or against a claim about the variables. To use it, point to specific features of the plot: the direction of the trend, how many points fall in a region, where points sit compared to a reference line, or a cluster.
One trick shows up often. When both variables measure the same thing on the same scale (a score before and after, a price this year and last year), draw the line . A point above that line has , a point below it has , and a point on it didn't change.
Example 3: Did scores improve? (AP-style)
Suppose a teacher gave 15 students a pretest, then a two-week review program, then a posttest. Both tests are out of 100. The scatterplot shows each student's two scores, with the line .
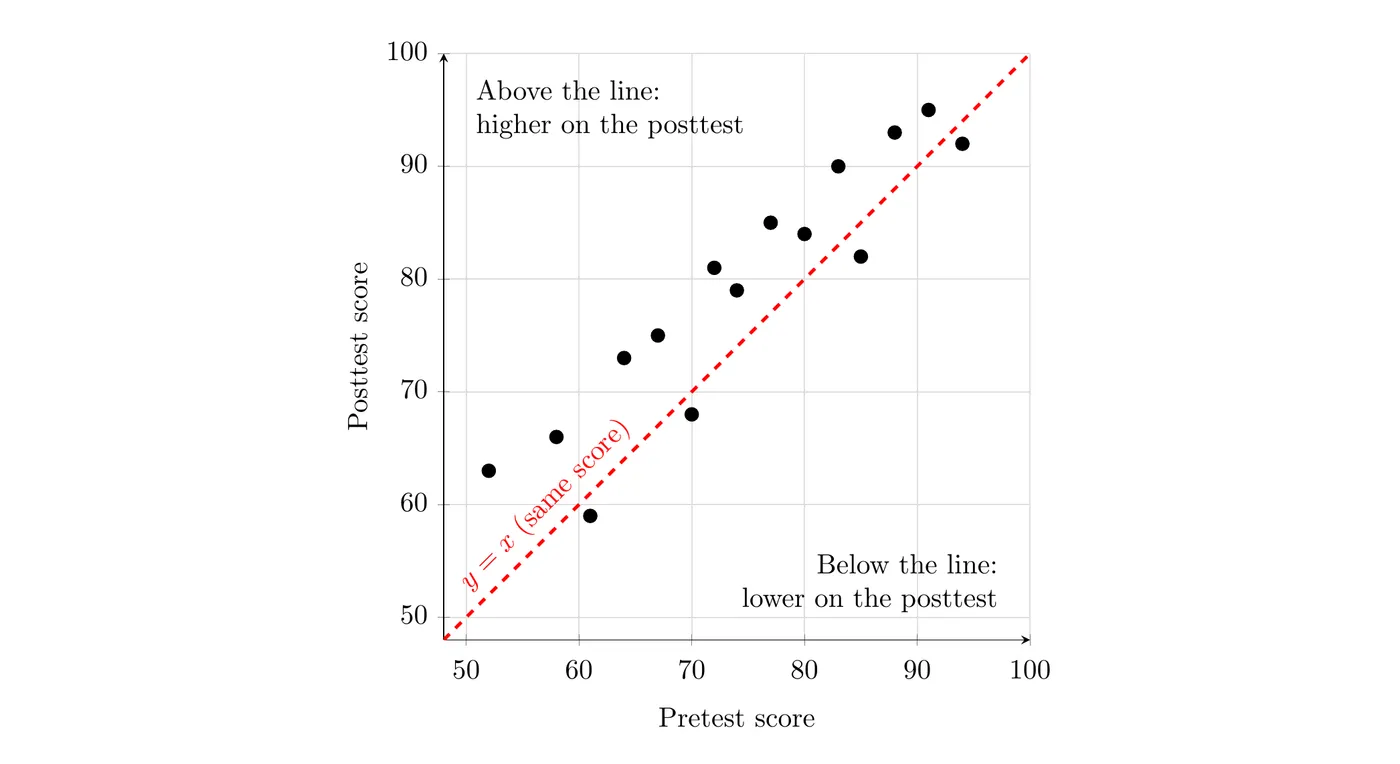
(a) A school leader claims that most of these students scored higher on the posttest than on the pretest. Does the scatterplot support the claim?
Yes. A point above the line means that student's posttest score is higher than the pretest score. 11 of the 15 points (about 73%) are above the line, so most of these students scored higher on the posttest.
(b) A parent claims every student improved. Does the scatterplot support this claim?
No. Four points are below the line , for example the student who scored 61 on the pretest and 59 on the posttest. Those four students scored lower on the posttest, so not every student improved.
(c) Describe the association between the scores.
There is a strong, positive, linear association between pretest and posttest scores, with no unusual points: students who scored higher on the pretest tended to score higher on the posttest.
Notice what the plot can't show: that the review program caused the improvement. There's no comparison group of students who skipped it. Showing cause and effect takes an experiment (Topic 1.13).
Common mistakes
- Putting the response on the -axis. Ask "what am I using to predict what?" The predictor goes on the horizontal axis.
- Describing with only and . Use the variable names and units from the problem.
- Leaving out a feature. Every description needs form, direction, strength, and unusual features. If there's nothing unusual, say so.
- Treating "positive" as "every point goes up." It means the response tends to increase as the explanatory variable increases.
- Justifying linear form with "the points make a line." Give evidence instead, like "the points follow a straight-line pattern with no curve."
- Pairing values from different individuals. Each dot must be one individual's two measurements.