

3.3 - Survivorship Curves
Learning Objectives
The main objective is explaining survivorship curves and showing how they track the survival rates of a population cohort. The skill practiced is data analysis, specifically explaining patterns and trends in data to draw conclusions.
Introduction and Core Concepts
A survivorship curve is a line on a graph showing the number or proportion of individuals from a specific group, called a cohort, that are still alive at each age the group reaches.
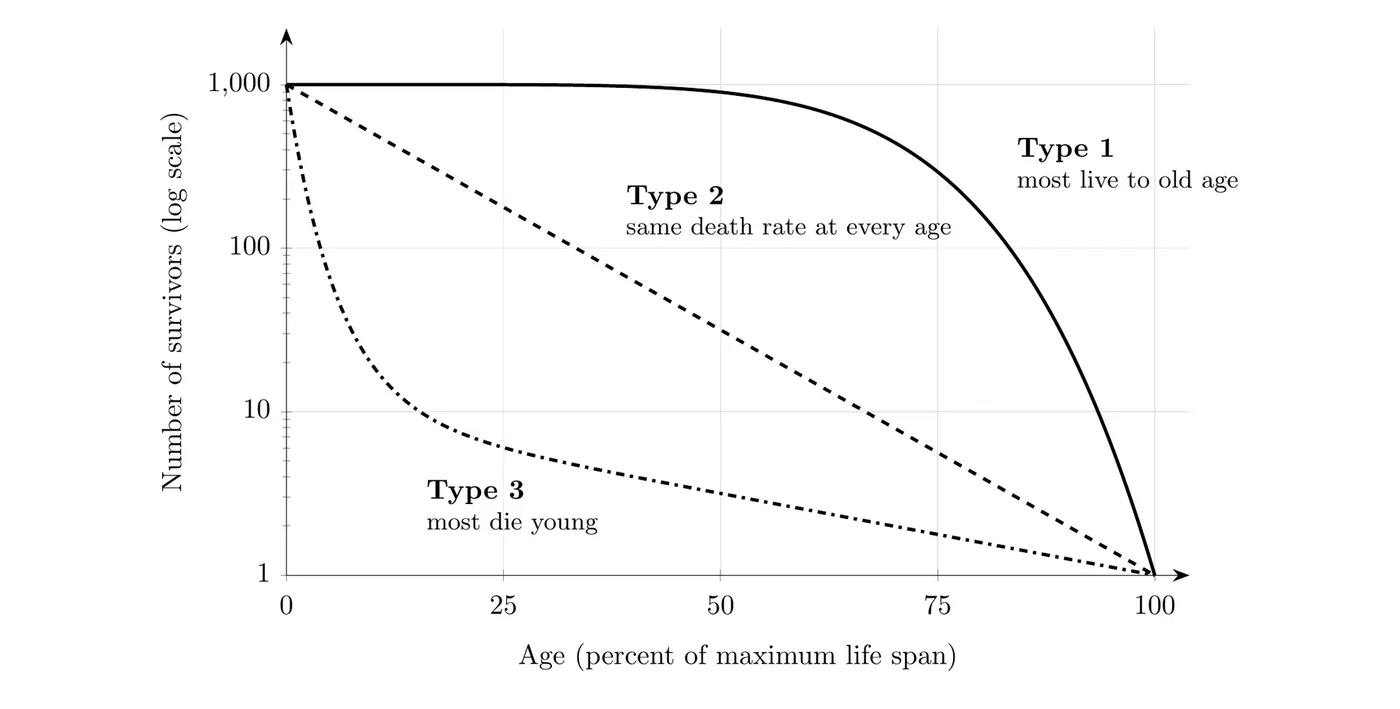
- The y-axis represents survivorship, the proportion of individuals still alive.
- The x-axis represents time or age.
- Note: The age units on the x-axis are relative units, meaning the graph compares the percentage of a species’ total lifespan reached, not the absolute number of years.
- Cohort: A group of individuals all born at the same time, so they’re the same age. The curve follows one cohort from birth until its last member dies, which is why it runs from birth to the maximum age any member reached.
- Log scale: On most survivorship graphs, including the one above, the y-axis is a logarithmic scale (1, 10, 100, 1,000). Each step down means the number of survivors dropped by a factor of 10. On this scale, a constant death rate (the same fraction dying at every age) shows up as a straight line, which is why Type 2 is a straight diagonal.
- Reading the graph: The steepest part of a curve is where the death rate is highest. In the graph above, about 900 of the original 1,000 Type 1 individuals are still alive at 50% of the maximum life span, but only about 30 Type 2 individuals are. The Type 3 curve drops to about 20 survivors by just 10% of the maximum life span, which means 98% of that cohort died very young.
Link to Reproductive Strategies
Survivorship curves build on the concepts of r-selected and K-selected species. The strategy a species uses, specifically the amount of parental care it provides, determines the survivorship of its young.
The Three Basic Survivorship Trends
There are three basic trends, Type 1, Type 2, and Type 3, defined by when in their lifespan individuals experience the highest mortality rate.
1. Type 1 Survivorship (K-Selected)
Type 1 curves are associated with K-selected organisms.
- Curve shape: A gentle decline early in life, followed by a steep drop late in life.
- Characteristics: These organisms have high survivorship during infancy and midlife.
- Early life: High survival thanks to intensive parental care, like a grizzly defending its cubs or a chimp breastfeeding.
- Midlife: High survival continues because once fully developed, they’re often large organisms capable of defending themselves, or they use behavioral adaptations like living in herds to escape predators.
- Late life: A rapid decrease in survivorship as old age sets in.
- Examples: Whales and most humans.
2. Type 3 Survivorship (r-Selected)
Type 3 curves are associated with r-selected species.
- Curve shape: A steep, rapid decrease early in life. Once individuals survive their initial stages, the decline in survivorship is relatively slow.
- Characteristics: These species experience very high mortality early in life.
- Reason: That high early death rate comes from providing little to no parental care. Tree seedlings, for example, are easily eaten, stepped on, or shaded out by other vegetation.
- Strategy: They compensate for low survivorship by producing lots and lots of offspring.
- Examples: Insects, fish, plants like dandelions, and trees.
3. Type 2 Survivorship (Intermediate)
Type 2 curves represent the middle ground of the survivorship spectrum.
- Curve shape: A constant, steady decline in survivorship throughout the entire life.
- Characteristics: They typically receive a small amount of parental care early on. But they’re often smaller organisms, which means they’re less capable of protecting their young from disease or predators.
- Survival guarantee: For a Type 2 species, surviving infancy (like a chick leaving the nest) does not guarantee reaching full adulthood.
- Examples: Rodents and birds.
- Link to r and K: K-selected species usually follow a Type 1 or Type 2 curve, and r-selected species follow a Type 3 curve. Birds show why Type 2 can still be K-selected: they lay small clutches of eggs and feed their chicks, but adults keep dying at a steady rate from predators, disease, and accidents all their lives.
Big picture: The survivorship curve is a graphic representation of a species’ reproductive gamble. K-selected species (Type 1) bet everything on quality control, investing heavily in a few offspring so that most survive until old age. r-selected species (Type 3) play the numbers game, sacrificing most of their tiny, unprotected offspring so that only the few hardiest individuals survive to reproduce.