

3.6 - Age Structure Diagrams
Learning Objectives
The primary objective is explaining age structure diagrams. The associated skill is data analysis, specifically explaining patterns and trends in data to draw conclusions.
Introduction to Human Populations
This topic shifts focus from natural ecosystems, where population factors like reproductive strategies impact growth, to human populations. Human populations don’t follow all the rules of natural populations, because humans have developed the ability to alter their own resource availability and their carrying capacity.
Diagram Structure and Interpretation
An age structure diagram reveals a great deal about a human population. Diagrams are typically grouped by country.
Layout and Units
- Y-axis: Age cohorts, meaning groups of individuals all born within the same time period, typically a four to five year range.
- X-axis: The number of individuals in each age cohort.
- Bar width: How far out the bar projects represents how large the age cohort is. For example, the 0 to 4 year old female age cohort in the U.S. projects out to about 9 million individuals (Census Bureau estimate for July 2024).
- Males and females: Males are shown on the left of the center line and females on the right.
- Numbers or percents: Some diagrams show the number of people in each bar, and others show each bar as a percent of the whole population. Percents make it easier to compare a large country with a small one.
Essential Knowledge
The shape of an age structure diagram tells us the growth rate of the country.
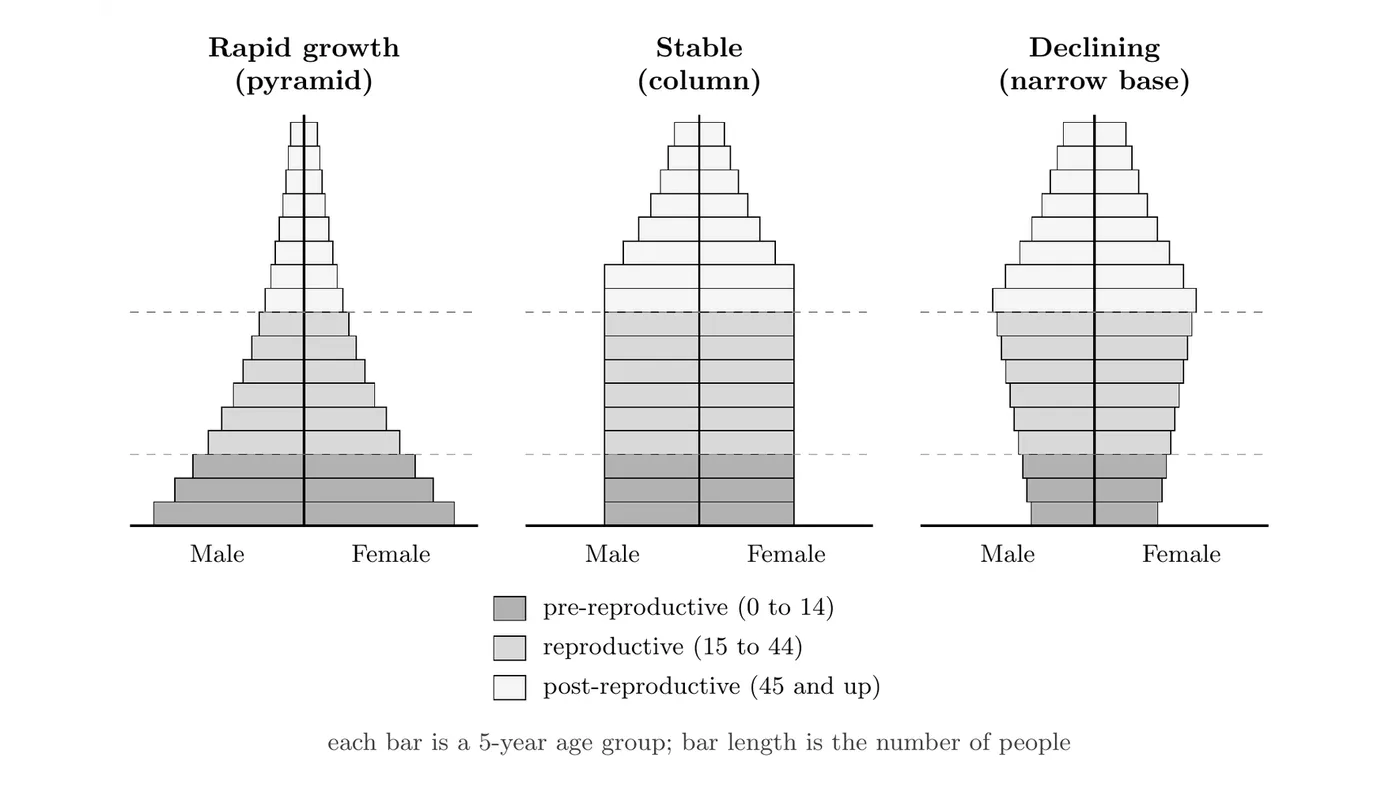
- The fundamental trend: the more rapidly a population is growing, the higher the proportion of young people it will have.
- That high proportion of young people contrasts with populations that are stable (not growing much) or declining.
The Three Major Age Cohorts
Demography, the study of human populations, groups the population into three major age cohorts:
- Pre-reproductive age: 0 to 14 years old.
- Reproductive age: 15 to 44 years old.
- Post-reproductive age: 45 plus years old.
The sizes of these three cohorts get compared to determine the country’s growth rate.
Interpreting Shapes and Growth Rates
The shape of the diagram is defined by the relative sizes of the pre-reproductive and reproductive cohorts. Understanding that size relationship explains the growth rate.
Diagram Shape | Interpretation (Growth Rate) | Cohort Comparison | Implications and Future Growth |
Pyramid or triangle (extreme or less extreme) | Growing, or rapid population growth. | The pre-reproductive cohort (0-14) is the largest. | The reproductive age group is having lots of children. This ensures future growth, because everyone in the 0-14 cohort has yet to grow up and start having their own children. |
House or column (relatively uniform) | Stable, or slight growth/decline. | Pre-reproductive and reproductive cohorts are roughly the same size. | The reproductive age group is having only the number of children needed to replace them. |
Narrow base / inverted pyramid | Declining or shrinking. | The reproductive cohort (15-44) is larger than the pre-reproductive cohort (0-14). | The population is having fewer children than are needed to replace them. This is typical of highly affluent countries like Germany and Italy. |
Real examples of each shape:
- Pyramid: Niger, where women average about 6 children (UN estimate for 2024) and the population is one of the youngest in the world.
- Column: The United States. Its TFR (about 1.6 in 2025) is below replacement, but immigration keeps the population growing slowly, so the bars stay fairly even up into the older ages.
- Narrow base: Japan, where the TFR fell to a record low of 1.14 in 2025 and the population has been shrinking for more than a decade.
Population Momentum
A pyramid-shaped population keeps growing for decades even after its TFR drops to replacement level. This is called population momentum. The huge 0 to 14 cohort hasn’t had children yet. When those kids reach reproductive age, there are so many of them that total births stay high, even if each woman has only about 2 children.
- Example: India’s TFR fell to 1.9 in 2023, below replacement, but its population is still growing because its large young cohorts are now in their reproductive years. Births (18.4 per 1,000 people) still far outnumber deaths (6.4 per 1,000), according to India’s Sample Registration System for 2023.
Big picture: An age structure diagram is basically a population’s economic forecast. A wide, heavy base (pyramid shape) indicates a massive future labor pool and high demands on resources (rapid future growth), while a narrow, inverted base suggests a future shortage of young workers and a high burden on social systems (future decline).