

3.9 - Demographic Transition
Learning Objectives
The goal is to explain the process of demographic transition. That means understanding how development from a pre-industrial to an industrial economy affects a country’s birth rate and death rate. The associated skill is explaining environmental concepts, processes, and models in an applied context.
Introduction: The Model
The Demographic Transition Model is a four-stage model describing how a country’s population changes as it becomes more developed. Development here means a country shifting its economic system from an agrarian (farming) based society to an industrial society based on manufacturing and services.
The model tracks three key variables over time:
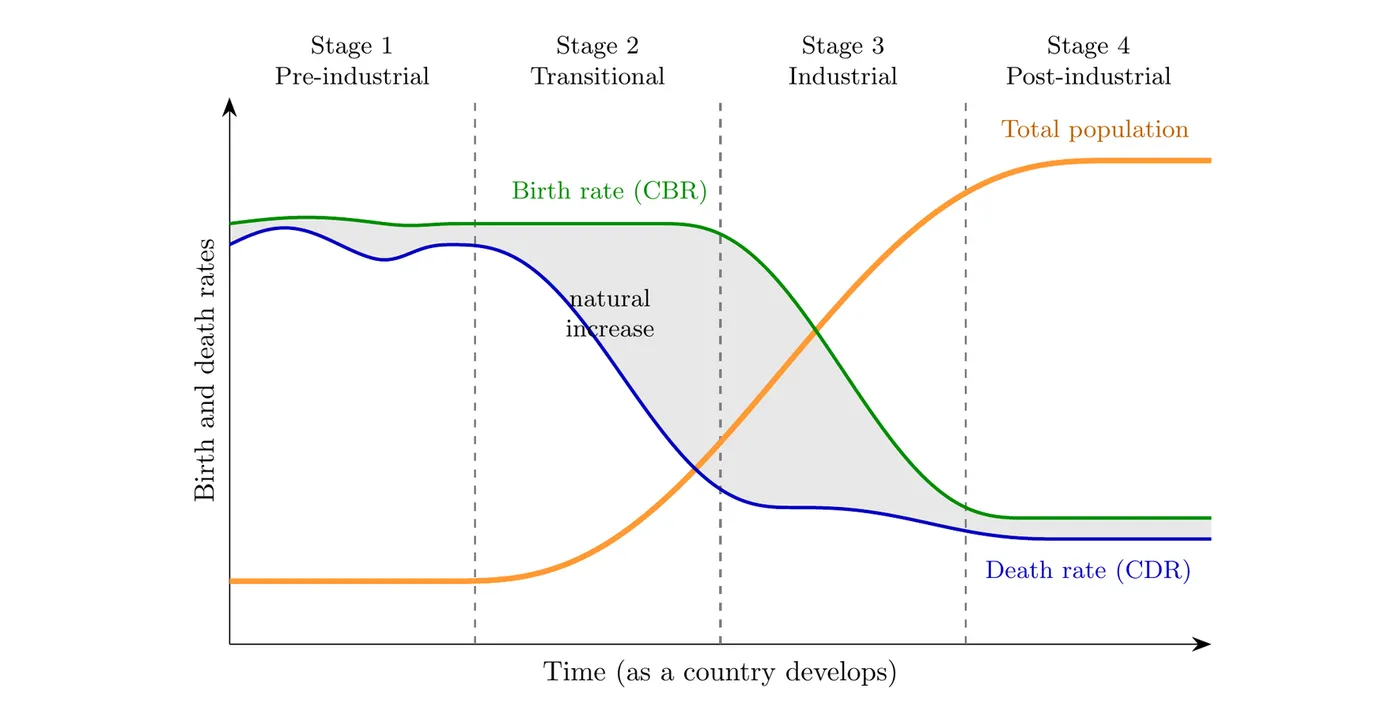
- Birth Rate (CBR): the green line
- Death Rate (CDR): the blue line
- Population Growth: the light orange line
The Four Stages of Transition
The whole transition works because death rate typically drops before birth rate does, which creates periods of high population growth.
Stage 1: Pre-Industrial (High Stationary)
- Characteristics: Typical of the least developed nations that haven’t started industrializing. Residents are usually very poor with low incomes and rely heavily on growing and selling excess food.
- Rates:
- High Death Rate: From lack of access to clean water, a stable food supply, and healthcare like hospitals and vaccines.
- High Birth Rate (TFR): From lack of educational opportunities for women, lack of access to family planning and contraceptives, and the high need for children to provide agricultural labor and income.
- Growth: Since high CBR and high CDR are roughly equal, the population sees zero or very low growth.
- Current Status: Basically no countries are still purely in Stage 1.
Stage 2: Transitional (Early Developing)
- Characteristics: Modernization has started, bringing more wealth and access to resources. Today this stage mostly describes the poorest countries, many of them in sub-Saharan Africa. Examples (as of 2026): Niger and Afghanistan.
- Rates:
- Rapidly Decreasing Death Rate: More access to clean water, stable food, and healthcare makes infant mortality and death rates drop substantially.
- High Birth Rate Remains: TFR stays high because of a generational lag time. Cultural norms around having many children take decades to shift, children are still needed for farm work, and educational and economic opportunities for women often lag behind men.
- Growth: Because death rate falls fast while birth rate stays high, the country hits its most rapid population growth. The age structure diagram would show a pronounced upward triangle or pyramid.
- Indicators: Low per capita GDP and low literacy rates for women.
Stage 3: Industrial (Late Developing)
- Characteristics: Modernization has substantially raised family income, and jobs are shifting from farming to manufacturing and services. These are mostly middle-income, industrializing countries. Examples (as of 2026): Egypt, where the TFR fell to about 2.4 in 2024, and India. India’s TFR dropped to 1.9 in 2023, but its birth rate (18.4 per 1,000) is still far above its death rate (6.4 per 1,000), so it’s in late Stage 3, moving into Stage 4.
- Rates:
- Low Death Rate: Stays low thanks to high access to resources.
- Falling Birth Rate: TFR starts to drop dramatically because:
- Educational and economic opportunities for women increase.
- Families delay marriage and their first child to pursue education and careers.
- Access to family planning and contraceptives becomes widely available.
- The need for children to provide farm labor decreases.
- Growth: Growth slows as CBR drops closer to CDR. TFR is usually closer to the replacement level of 2.1.
- Indicators: Rising per capita GDP (usually middle income), longer life expectancy, and a rising standard of living.
Stage 4: Post-Industrial (Low Stationary or Declining)
- Characteristics: These nations have gotten so affluent and modern that the birth rate has fallen to about the same level as the death rate (or below it), so natural increase is near zero or negative. TFR is usually below the replacement level of 2.1. Examples: the United States, Canada, the United Kingdom, Germany, Italy, Japan, and South Korea.
- Rates: Both CBR and CDR are quite low.
- TFR drops below 2.1 because families prioritize careers and education, so they have fewer children and have them later.
- Growth: Population growth slows to close to zero and may even start to decline.
- Indicators: The highest per capita GDPs in the world and very high life expectancy. The age structure diagram would show a higher proportion of elderly individuals than any other stage.
- Recent Data (2025): Japan’s TFR fell to a record low of 1.14, South Korea’s was 0.80 (the lowest in the world), and the U.S. was about 1.6. In Japan, Italy, and China, deaths now outnumber births, so their populations are shrinking. China reached these low birth rates while still a middle-income country, partly because of its One-Child Policy (Topic 3.7).
- Stage 5? Some textbooks add a fifth stage for countries whose death rate is now higher than their birth rate, like Japan and Italy. The AP course uses the four-stage model.
Developing vs. Developed Countries
Two things set developing countries apart from developed ones:
- Higher Infant Mortality: Mothers and babies have less access to good health care, clean water, and nutrition, so more infants die (Topic 3.7). In 2024, sub-Saharan Africa’s IMR was about 47 deaths per 1,000 live births, compared with about 4 in high-income countries (World Bank and UN estimates).
- More Children in the Workforce: In poorer, farm-based economies, many children work to help support their families, often instead of going to school. Worldwide, about 138 million children were in child labor in 2024. About 61% of them worked in agriculture, and about 87 million lived in sub-Saharan Africa (ILO and UNICEF, 2025).
- Why It Matters for the Model: When children bring in income and many infants die, families have more children. As a country develops, child labor laws and schooling make children cost money instead of earning it, and IMR falls, so birth rates drop. That’s the shift from Stage 2 to Stage 3.
Big picture
The Demographic Transition Model charts a country’s development by showing the lag time between health improvements and social changes. Think of a country crossing a bridge over a river. At first, the number of people entering and leaving is about equal and both are high (Stage 1). Health improvements build a barrier stopping people from leaving (falling death rate), which causes a massive traffic jam (rapid growth in Stage 2). Eventually social factors like education and careers mean fewer people enter the bridge in the first place (falling birth rate), and the flow stabilizes (Stages 3 and 4).