

2.1 - The Circular Flow and GDP
The Circular Flow Diagram
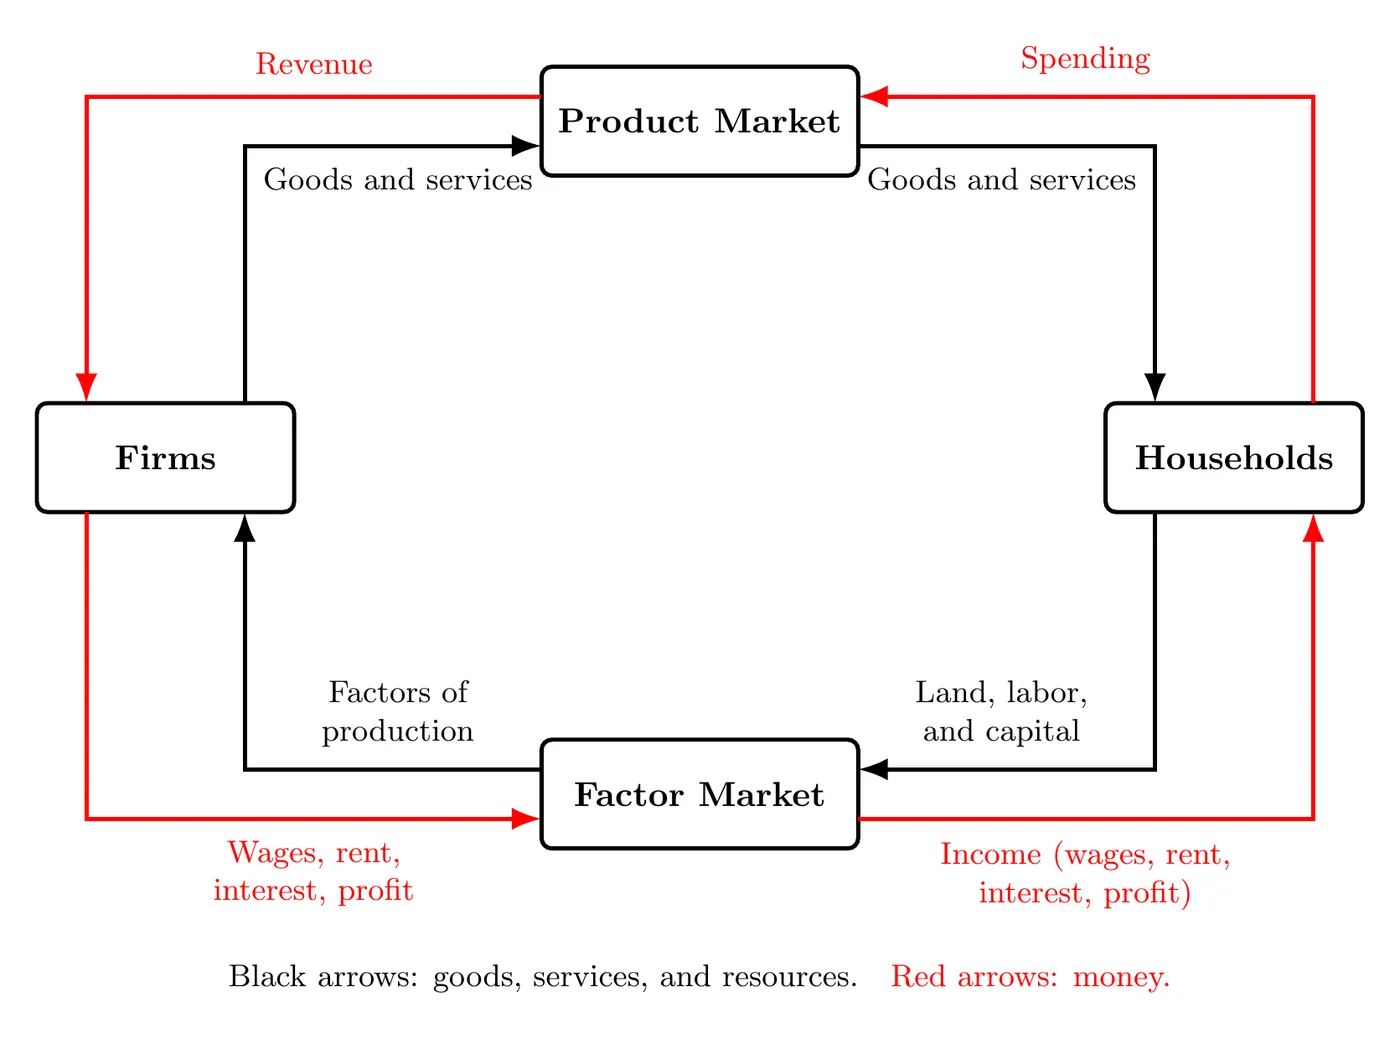
Macroeconomics studies the economy as a whole, and the circular flow diagram is a simplified model of it. It has two main groups: households (people) and firms (businesses), and two markets: the factor market, where firms buy factors of production, and the product market, where households buy final goods and services.
Households own and sell land, labor, and capital to firms in the factor market. Firms use these to create final goods and services. Money flows the other way: firms pay households for their labor (income), and households pay firms for goods and services (spending). In this model, total spending always equals total income.
That’s why the circular flow is a picture of GDP. Every dollar a household spends on a final good becomes a dollar of income for someone (the workers, landowners, lenders, and owners of the firm that made it). So you can measure GDP by adding up all the spending flowing into the product market, or by adding up all the income flowing to households from the factor market, and you get the same total.
The simple diagram only has households and firms. Fuller versions add the government (which collects taxes and buys goods and services) and the rest of the world (which buys our exports and sells us imports). That’s where G and in the GDP formula below come from.
Defining GDP
GDP, or Gross Domestic Product, measures the total value of all final goods and services produced in an economy over a given time period. It’s considered the granddaddy of macro measurements, since it shows how productive an economy is.
A few key rules for counting GDP:
- Final goods are the finished product a consumer actually uses.
- Intermediate goods, like cotton or dye used to make a shirt, don’t count toward GDP.
- GDP only counts goods made during the specific time period being measured, usually a year.
- Used goods don’t count, since they were already counted when they were first made and sold.
- Domestic means made inside the country’s borders, no matter who owns the company. A Toyota built in Kentucky counts in US GDP. A car Ford builds in Mexico counts in Mexico’s GDP, not ours.
- Unsold goods still count. If a firm makes something this year but hasn’t sold it yet, it counts in this year’s GDP as an addition to the firm’s inventory (part of investment, below). When it sells next year, it isn’t counted again.
Calculating GDP: Three Approaches
All three methods should, in theory, agree with each other.
1. Expenditures Approach (the most important one)
Adds up total spending in the economy:
( stands for GDP, also called national income or aggregate spending.)
- C (Consumption): money households spend on goods and services.
- I (Investment): spending on new physical capital, like tools, machinery, factories, and new construction. Mostly done by businesses, and it drives productivity gains and growth.
- Also counts changes in inventories (goods made this year but not sold yet). Buying stocks or bonds is not investment in the GDP sense, since nothing new is produced (see 2.2).
- G (Government spending): government purchases of goods and services, like bombs or road construction. Government transfer payments (Social Security checks, unemployment benefits, welfare payments) don’t count, since the government gets no good or service in return.
- Xn (Net exports): exports minus imports. Exports add to GDP, imports subtract from it.
- Why subtract imports? C, I, and G include spending on foreign-made goods, like a German car bought by an American family. Subtracting imports takes those back out, so GDP only counts what was made here.
Example: calculating nominal GDP. An economy has this data for the year (in billions of dollars): consumption $800, investment $200, government purchases $250, government transfer payments $90, exports $100, imports $150, and purchases of stocks and bonds $40.
- Net exports:
- Transfer payments and stock and bond purchases are left out, since nothing is produced.
- GDP , so GDP is $1,200 billion.
Because this spending is measured at this year’s prices, the answer is nominal GDP. If you’re given prices and quantities of final goods instead, multiply each final good’s price by its quantity and add them up. Topic 2.6 shows how to take out price changes to get real GDP.
2. Income Approach
Adds up the four ways people earn income:
These match up with the factors of production: wages for labor, rent for land, interest for capital, and profits for entrepreneurship.
3. Value Added Approach (least used in AP Macro)
Calculates the value each firm adds along the production chain of a good, found by subtracting the cost of inputs from the selling price of the firm’s output.
Example: a farmer grows wheat and sells it to a miller for $1 (assume the farmer buys no inputs). The miller grinds it into flour and sells it to a baker for $3. The baker makes bread and sells it to you for $5.
Firm | Sells for | Cost of inputs | Value added |
Farmer | $1 | $0 | $1 |
Miller | $3 | $1 | $2 |
Baker | $5 | $3 | $2 |
Total | $5 |
The total value added ($5) equals the price of the final good, the bread. If you added up every sale instead ($1 + $3 + $5 = $9), you’d count the wheat three times and the flour twice. That double counting is exactly why intermediate goods are left out of GDP.
Takeaway
The circular flow diagram shows households selling factors of production to firms, and firms turning those into goods sold back to households, keeping total spending equal to total income. GDP measures the total value of all final goods and services produced in a year, and the most important way to calculate it is the expenditures approach: .