

1.6 - Market Equilibrium, Disequilibrium, and Changes in Equilibrium
The Supply and Demand Model
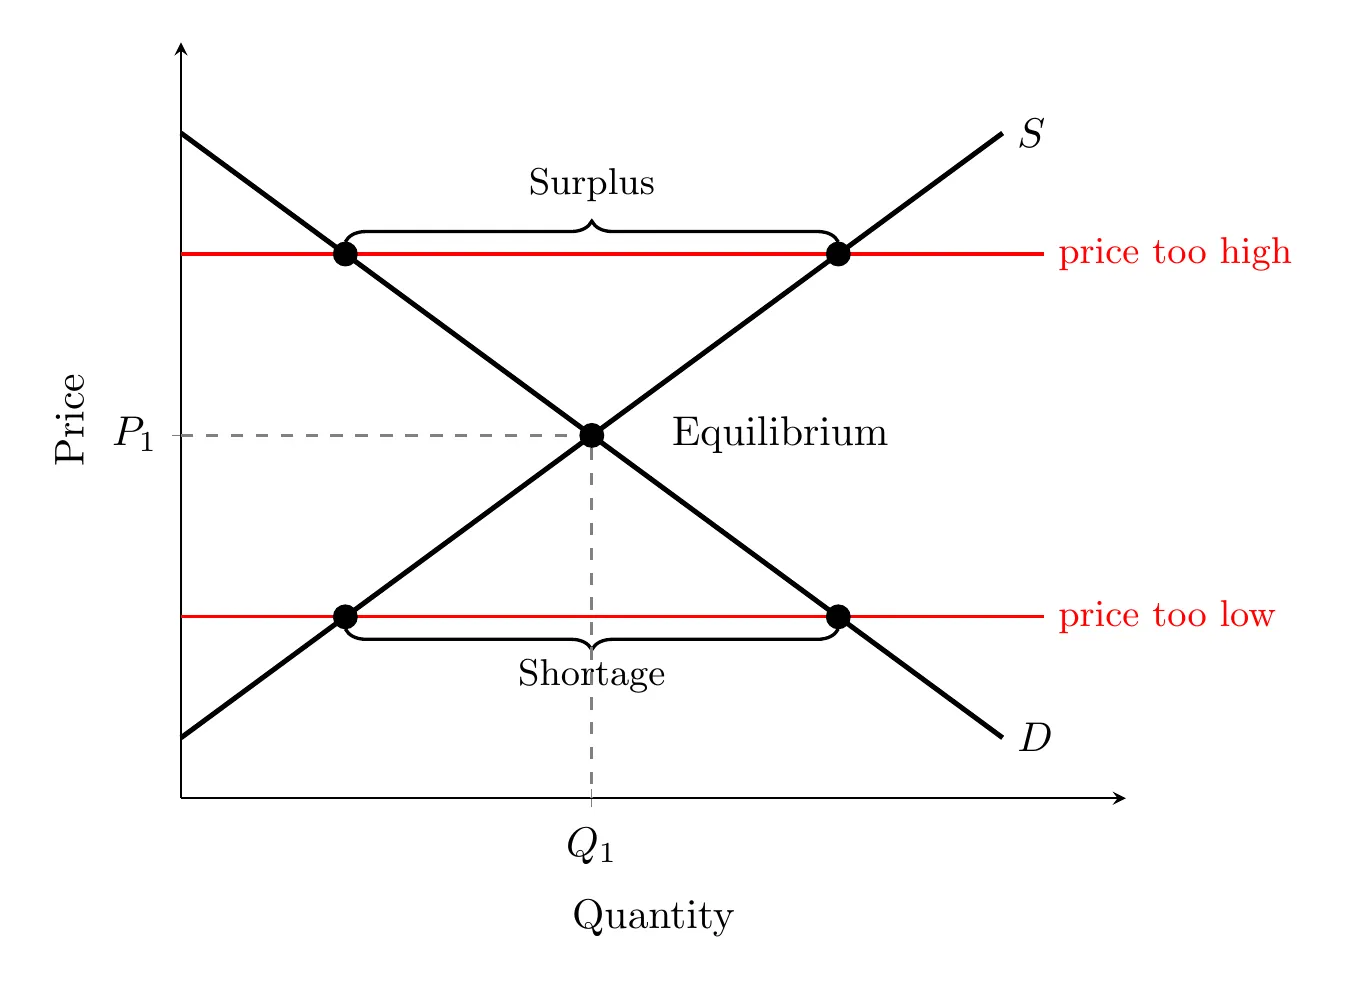
This model examines how buyers and sellers interact. Price sits on the vertical axis, quantity on the horizontal axis. Demand slopes downward (buyers like low prices), and supply slopes upward (sellers like high prices).
Market Equilibrium
Equilibrium is where the supply and demand curves cross. At that point, quantity supplied equals quantity demanded. You find the equilibrium price () and quantity () by drawing lines from that intersection down to each axis. The market is balanced here.
Disequilibrium: Shortages and Surpluses
When the market isn’t at equilibrium, it’s in disequilibrium.
- Surplus (price too high): quantity supplied is greater than quantity demanded. The gap between the two is the surplus. Market forces push the price down until the surplus disappears.
- How the price adjusts: sellers stuck with unsold goods start cutting prices. As the price falls, buyers want more (quantity demanded rises) and sellers offer less (quantity supplied falls), until the two meet at equilibrium.
- Shortage (price too low): quantity demanded is greater than quantity supplied. The gap here is the shortage. Market forces push the price up until it clears.
- How the price adjusts: buyers who can’t get the good are willing to pay more, and sellers see they can charge more. As the price rises, quantity demanded falls and quantity supplied rises, until the shortage is gone.
Price acts as a signal, giving both buyers and sellers information about preferences and how scarce something really is.
Calculating a surplus or shortage: at a given price, subtract the smaller quantity from the bigger one. If quantity supplied is bigger, it’s a surplus. If quantity demanded is bigger, it’s a shortage. Here’s a market for pizzas:
Price | Quantity demanded | Quantity supplied | Result |
$2 | 80 | 20 | Shortage of 60 |
$3 | 70 | 40 | Shortage of 30 |
$4 | 60 | 60 | Equilibrium |
$5 | 50 | 80 | Surplus of 30 |
$6 | 40 | 100 | Surplus of 60 |
At $6, sellers want to sell 100 pizzas but buyers only want 40, a surplus of pizzas, so the price falls. At $3, buyers want 70 but sellers only offer 40, a shortage of pizzas, so the price rises. Only at $4 do the two quantities match, so the equilibrium price is $4 and the equilibrium quantity is 60.
Analyzing Shifts in Equilibrium
A shift in supply or demand changes both equilibrium price and quantity:
Shift Type | Curve Movement | Effect on Price | Effect on Quantity | Notes |
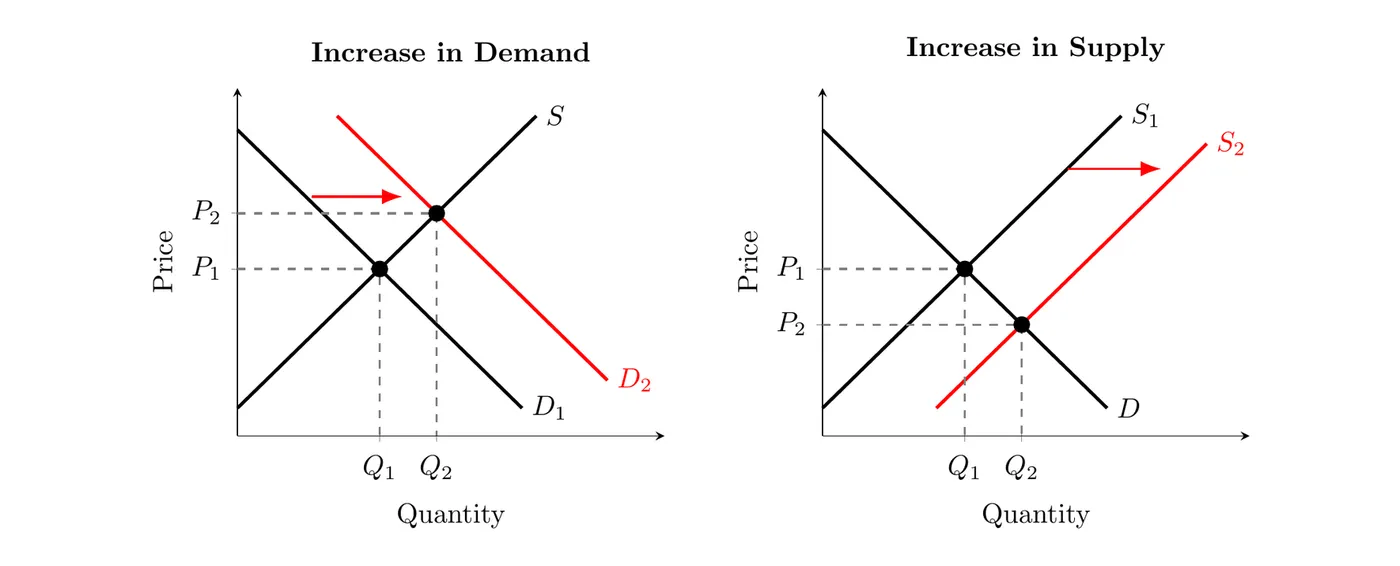
Increase in Demand | Right | Rises | Rises | Whatever happens to demand happens to both price and quantity |
Decrease in Demand | Left | Falls | Falls | |
Increase in Supply | Right | Falls | Rises | Best outcome for consumers, cheaper and more available |
Decrease in Supply | Left | Rises | Falls | Worst outcome for consumers, more expensive and less available |
Working through a shift: figure out which curve the event moves (a change on the buyers’ side shifts demand, a change on the sellers’ side shifts supply), then which direction, then read the new equilibrium off the graph.
- Incomes rise, and pizza is a normal good: demand for pizza increases (shifts right), so the equilibrium price and quantity both rise.
- A new oven bakes pizzas twice as fast (technology): the supply of pizza increases (shifts right), so the equilibrium price falls and the equilibrium quantity rises.
Simultaneous Shifts
When both supply and demand shift at once, one variable (price or quantity) ends up indeterminate. To work through it, compare the known effect of each individual shift.
Example: both demand and supply increase. A demand increase pushes price up and quantity up. A supply increase pushes price down and quantity up. So price is indeterminate (one shift pushes it up, the other down), but quantity definitely rises since both shifts push it up.
Here are all four double shifts. The variable that gets pushed in opposite directions is the indeterminate one. Which way it actually goes depends on which shift is bigger, so unless the question tells you that, the answer is “indeterminate.”
Demand | Supply | Price | Quantity |
Increase | Increase | Indeterminate | Rises |
Decrease | Decrease | Indeterminate | Falls |
Increase | Decrease | Rises | Indeterminate |
Decrease | Increase | Falls | Indeterminate |
Takeaway
Demand sloping down and supply sloping up together determine market equilibrium, where what buyers want to buy matches what sellers want to sell. Any deviation creates a surplus (price too high) or shortage (price too low), which market forces correct by nudging the price back toward equilibrium. When curves shift due to outside factors, we can predict the effect on price and quantity, though a demand shift moves both in the same direction, and simultaneous shifts leave at least one outcome uncertain.