

2.7 - Business Cycles
Introduction to Business Cycles
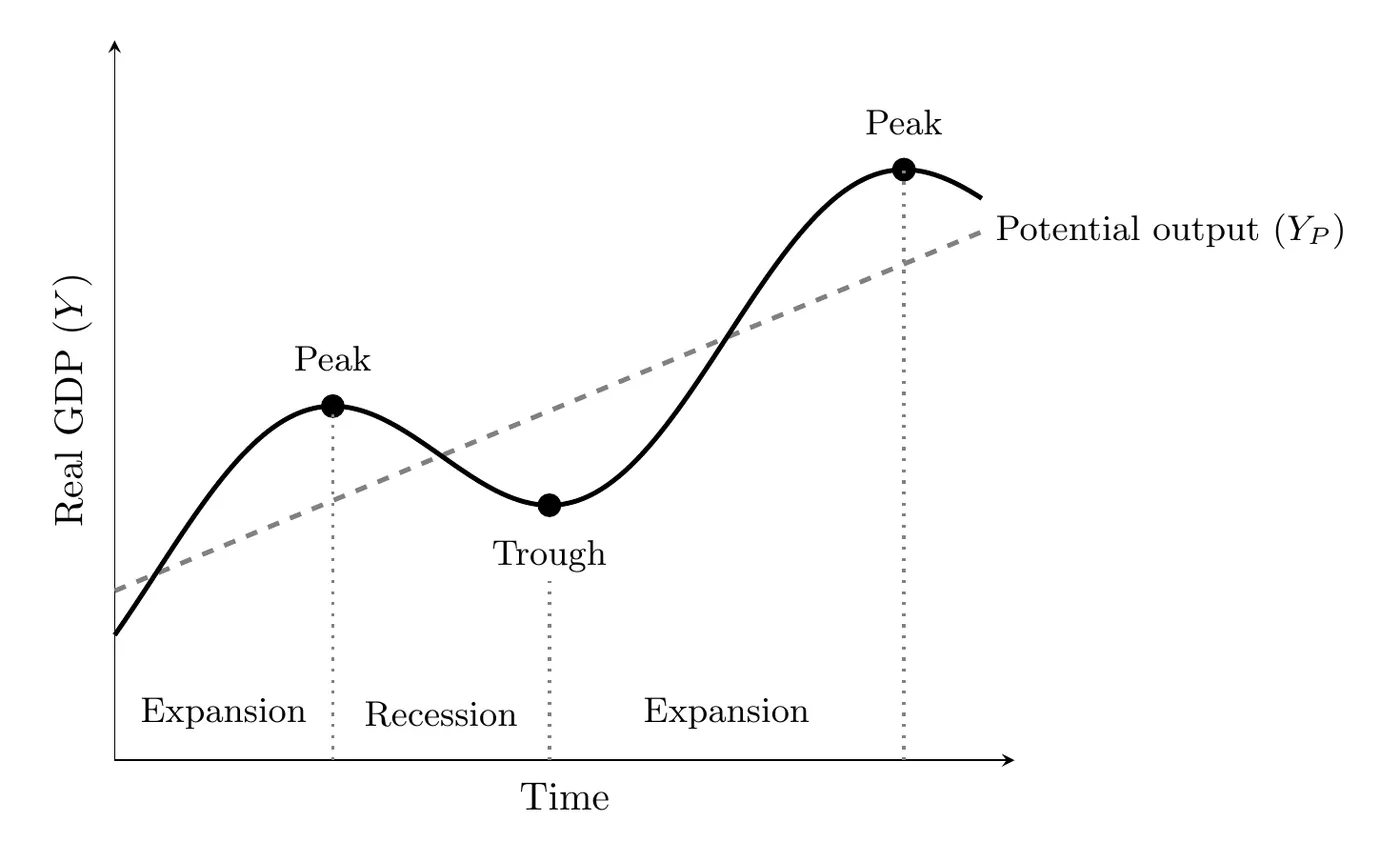
Studying business cycles is really the whole reason macroeconomics exists. Business cycles are fluctuations in aggregate output, measured using real GDP (). In the model, the vertical axis is (real GDP) and the horizontal axis is time.
These swings show up in both output and employment, and they’re caused by changes in aggregate demand (total spending, like households suddenly cutting back) and/or aggregate supply (like a jump in oil prices that raises costs for most firms). You’ll model both in Unit 3.
Phases and Turning Points
- Expansion: GDP is increasing.
- Recession: GDP is falling.
- A common rule of thumb is two quarters in a row of falling real GDP. In the US, recessions are officially dated by the National Bureau of Economic Research (NBER), which looks at output, employment, income, and sales together.
Real GDP and unemployment move inversely: during an expansion, GDP rises and unemployment falls; during a recession, GDP falls and unemployment rises, since less production means firms need fewer workers.
- Peak: the high point, where GDP is maximized and unemployment is at its lowest.
- This turning point is where an expansion ends and a recession begins.
- Trough: the low point, where GDP bottoms out and unemployment peaks.
- This turning point is where a recession ends and the next expansion begins.
Reading the phases from data: here’s real GDP for six quarters (in billions of dollars).
Quarter | 1 | 2 | 3 | 4 | 5 | 6 |
Real GDP | $500 | $510 | $505 | $498 | $502 | $512 |
Real GDP rises until Quarter 2 (the peak), falls through Quarter 4 (the trough), and then rises again. So the economy is in a recession from Quarter 2 to Quarter 4, and in an expansion before Quarter 2 and after Quarter 4.
Potential Output (/)
The model also includes a trendline called potential output () or full employment output (), the level of GDP an economy can produce when fully using its resources. Full employment means there’s no cyclical unemployment, and here the actual unemployment rate equals the natural rate.
- Below potential: actual output below means cyclical unemployment exists, pushing the unemployment rate above the natural rate.
- Above potential: actual output above means the unemployment rate is below the natural rate.
- Output can stay above potential for a while (workers put in overtime, machines run extra shifts), but not forever. Stretched resources push up wages and prices, so it usually comes with rising inflation.
The Output Gap
The difference between actual output and potential output is the output gap.
- Positive output gap: actual output is greater than potential.
- Negative output gap: actual output is less than potential.
In the graph below, gray shading is a positive output gap and red shading is a negative one.
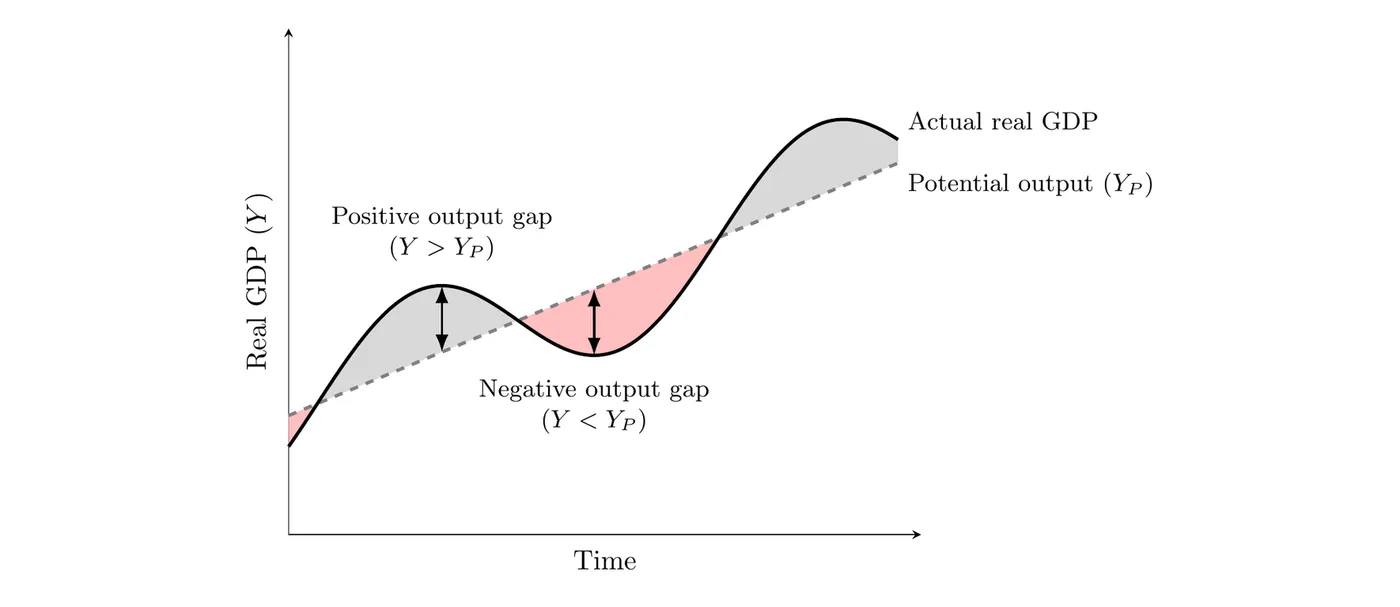
Example: if real GDP is $18 trillion and potential output is $20 trillion, the output gap is , a negative gap of $2 trillion. In Unit 3 you’ll also see these called a recessionary gap (negative) and an inflationary gap (positive).
Takeaway
The business cycle reflects fluctuations in real GDP, cycling between expansion and recession. It’s measured against potential output, the maximum sustainable level without triggering cyclical unemployment. Falling below potential output creates a negative output gap and signals cyclical unemployment.