

6.5 - Inequality
Reasons for Inequality
Non-market reasons (outside standard supply and demand):
- Differences in personal motivation or access to upward mobility. Mobility is how easily people can move to a place with better jobs, switch careers, or climb the income ladder. When it’s low, families tend to stay at the same income level for generations.
- Ability to inherit wealth or access credit. Inheritance lets wealth build up within families over generations. Access to financial markets (loans, credit, bank accounts) lets people borrow to pay for college or start a business, so people shut out of credit have a harder time building human capital or wealth.
- Social capital: the networks and relationships people can draw on. A family friend who passes along a job lead or an internship gives someone a head start that has nothing to do with their productivity.
- Differences in bargaining power. Workers in a labor union bargain as a group and usually win higher pay than they would alone, while a firm with monopsony power can hold wages down. Bargaining power matters inside families too: whoever earns or controls the money often has more say in how it’s spent.
- Discrimination that affects earnings regardless of productivity.
Market reasons (supply and demand in the labor market):
- Supply side: more education or specialized skill reduces the pool of qualified workers, raising their pay. Licensing requirements work similarly.
- Demand side: employers pay more for workers with strong human capital.
- Productivity: the more productive a worker (measured by marginal product), the more valuable their labor.
- MRP: since , a rise in either productivity or the product’s price raises labor demand and wages.
Each factor gets paid its marginal product: in competitive factor markets, every factor of production (labor, land, capital) earns the value of its marginal product (its MRP). That’s efficient, but it can still create inequality. An hour of a surgeon’s work adds far more value than an hour of a cashier’s, so it pays far more. And people who own land and capital earn rent and interest on top of any wages. Ownership of land and capital is very uneven, so the income it brings in is too.
Measuring Inequality
Income, Wealth, and Poverty
Inequality can be measured in income or in wealth, and they aren’t the same thing:
- Income: money received over a period of time, like wages, rent, interest, profit, and transfer payments. It’s a flow (for example, $50,000 a year).
- Wealth: the value of everything a household owns (a home, savings, stocks, a business) minus its debts, measured at one point in time. It’s a stock. Wealth is spread much less evenly than income, since it builds up over a lifetime and can be passed down.
- Poverty rate: the percentage of people whose income falls below the poverty line, a minimum income level the government sets.
Income levels and poverty rates vary a lot across groups (age, gender, race, education), within groups (two people of the same age and gender can earn very different amounts), and across countries (the typical household in a rich country earns many times what one in a low-income country earns). In the U.S., for example, earnings tend to rise with age until middle age and drop after retirement, women earn less than men on average, and poverty rates differ by race.
The Lorenz Curve
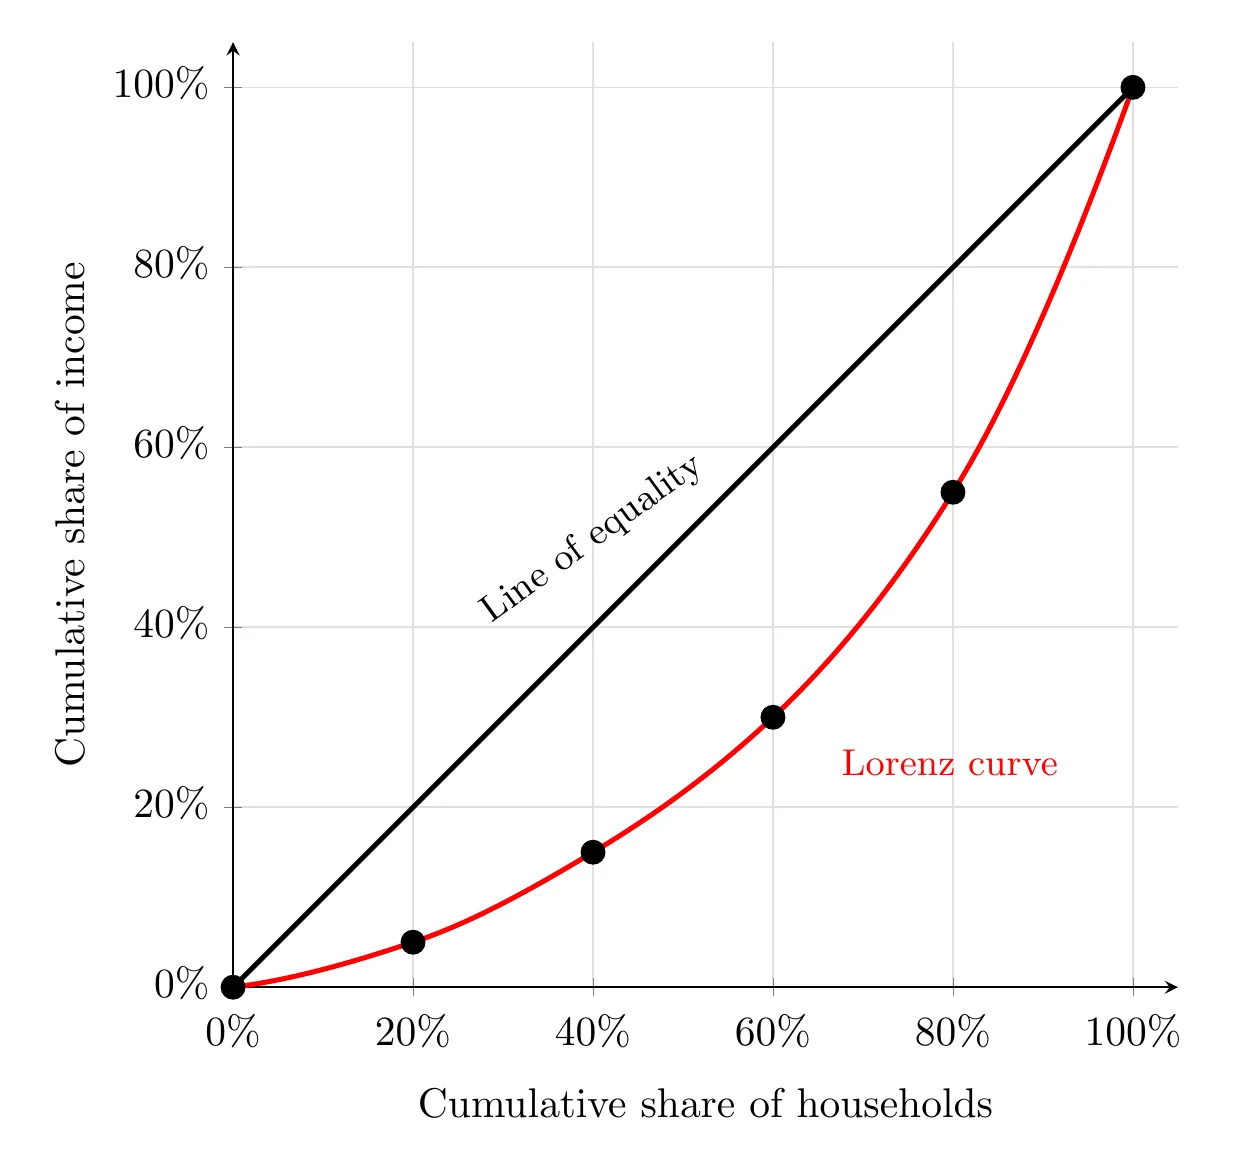
The Lorenz curve plots the cumulative share of households against the cumulative share of income they earn.
- Line of equality: a 45-degree diagonal representing perfectly equal distribution (the bottom 20% earning exactly 20% of income).
- The closer the Lorenz curve sits to that line, the more equal the distribution; the farther it strays, the more unequal.
The Gini Coefficient
A single number derived from the Lorenz curve (the area between the line of equality and the curve, divided by the total area under the line of equality).
- Ranges from 0 (complete equality) to 1 (complete inequality, one person has everything).
- Example: countries with lower coefficients, like Australia, have more equal income distribution than those with higher coefficients, like Brazil.
- Comparing distributions: both tools let you compare countries, one country over time (a rising Gini means inequality grew), or the effect of a policy. In the U.S., for example, the Lorenz curve for income after taxes and transfers sits closer to the line of equality than the one for income before them.
- On the AP exam: you won’t have to draw a Lorenz curve or calculate a Gini coefficient. You do need to read them and say which distribution is more equal.
Government Tools for Redistribution
Taxes, categorized by how the percentage paid changes with income:
- Progressive: percentage paid rises with income (U.S. income tax, estate tax). Shifts the Lorenz curve toward equality.
- Regressive: percentage paid falls as income rises (sales, gas, tobacco taxes), a bigger burden on lower earners even at the same dollar amount. Shifts the Lorenz curve away from equality.
- Proportional (flat): everyone pays the same percentage. Leaves the Lorenz curve unchanged.
Transfer payments: money the government gives directly to citizens, Social Security, unemployment insurance, food stamps, Pell Grants. More transfer payments reduce inequality and shift the Lorenz curve toward equality.
Bottom line: income inequality comes from a mix of personal productivity (MRP) and systemic factors like discrimination or inheritance. The Lorenz curve and Gini coefficient help visualize and measure that gap, while progressive taxation and transfer payments are the government’s main tools for spreading income more evenly.
BackNext