

1.2 - Opportunity Cost and the Production Possibilities Curve (PPC)
PPC Basics
The PPC is a simplified model used in both micro and macro. It shows what’s possible for an economy or a person to produce. To keep things simple, the model assumes an economy only makes two goods, say capital goods on the vertical axis and consumer goods on the horizontal axis. The curve itself usually slopes downward and marks the outer limit of what the economy can currently produce.
Core Concepts on the PPC
The PPC illustrates scarcity, opportunity cost, and trade-offs all at once.
- Scarcity: because resources are limited, you can’t produce unlimited amounts of both goods, so choices have to be made.
- Trade-offs: if an economy sitting on the PPC wants more of one good, it can only get there by producing less of the other.
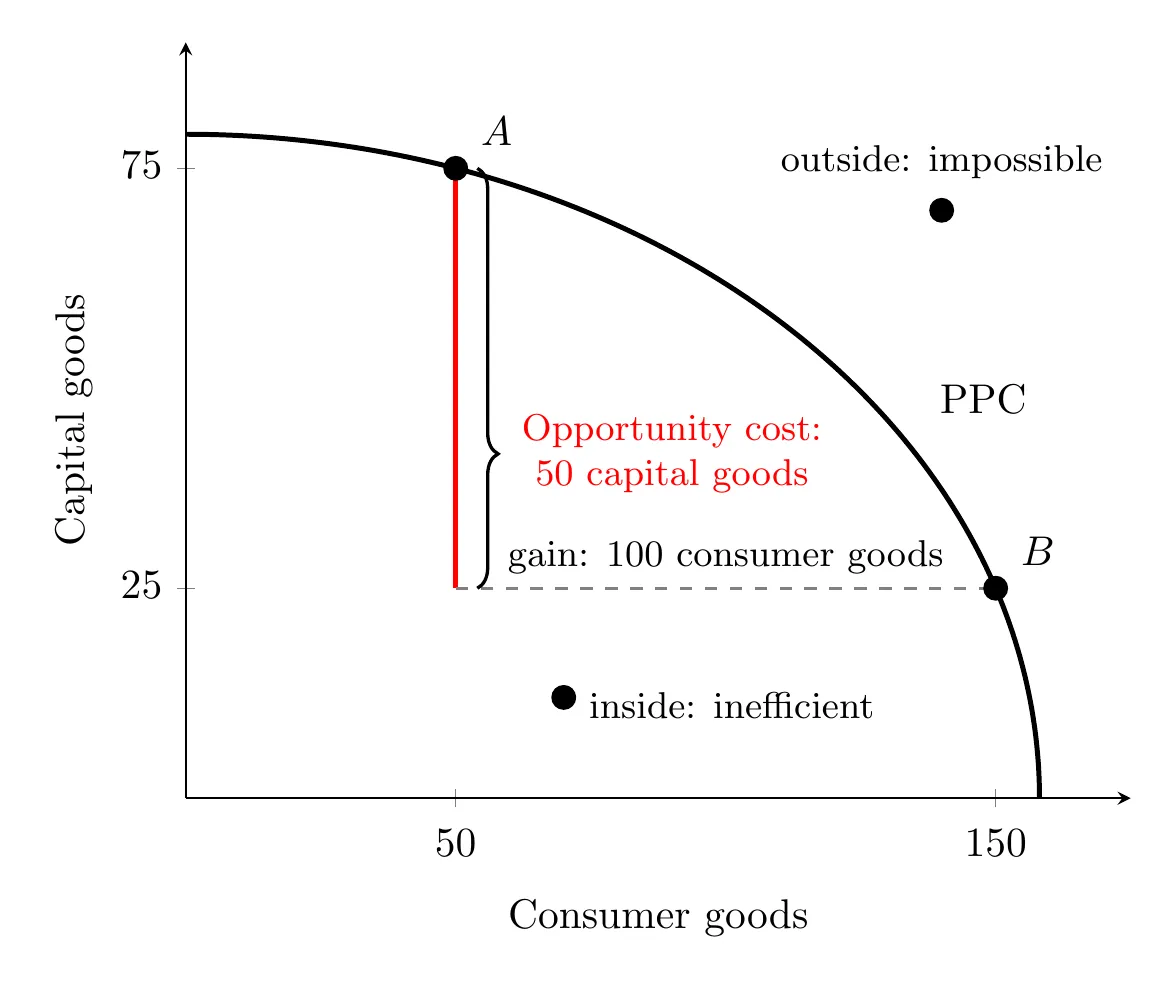
- Opportunity cost: what you give up to gain something else. For example, moving from 75 capital goods down to 25 capital goods (a cost of 50) lets you gain 100 consumer goods, so the opportunity cost here is 50 capital goods.
Calculating Opportunity Cost
To find the opportunity cost of one unit of a good, divide what you give up by what you gain:
In the graph at the top of the page, moving from point A to point B gives up 50 capital goods to gain 100 consumer goods, so over that move each consumer good costs capital goods. Going the other way (B to A), each capital good costs consumer goods. The two answers are always reciprocals of each other.
PPC data can also come as a table. Say an economy can make these combinations:
Point | Consumer goods | Capital goods | Capital goods given up for these 10 consumer goods |
A | 0 | 30 | n/a |
B | 10 | 28 | 2 |
C | 20 | 24 | 4 |
D | 30 | 18 | 6 |
E | 40 | 10 | 8 |
F | 50 | 0 | 10 |
Each batch of 10 consumer goods costs more capital goods than the one before (2, then 4, 6, 8, and 10). Per unit, a consumer good costs capital goods going from A to B, but capital good going from E to F. For a bigger move, use the totals: going from B to D gains 20 consumer goods and gives up 10 capital goods (28 down to 18), so each consumer good costs capital goods. Since the cost keeps rising, this PPC is bowed outward (more on shapes below).
Efficiency, Inefficiency, and Growth
- Efficiency means getting the most out of scarce resources. Any point right on the PPC counts as efficient, since you can’t make more of one good without giving up some of the other.
- Underutilized resources (inefficiency): any point inside the PPC means resources aren’t fully used. At a point like this, you could actually produce more of both goods.
- Full employment: in macro, any point on the PPC is the economy’s full employment level of output, with all of its resources in use. When unemployment rises, like during a recession, the economy moves to a point inside the curve. The PPC itself doesn’t shift, since the workers, land, and machines still exist. They’re just sitting idle. Getting back to full employment moves the economy back out to the curve.
- Impossible combinations: any point outside the PPC isn’t currently achievable.
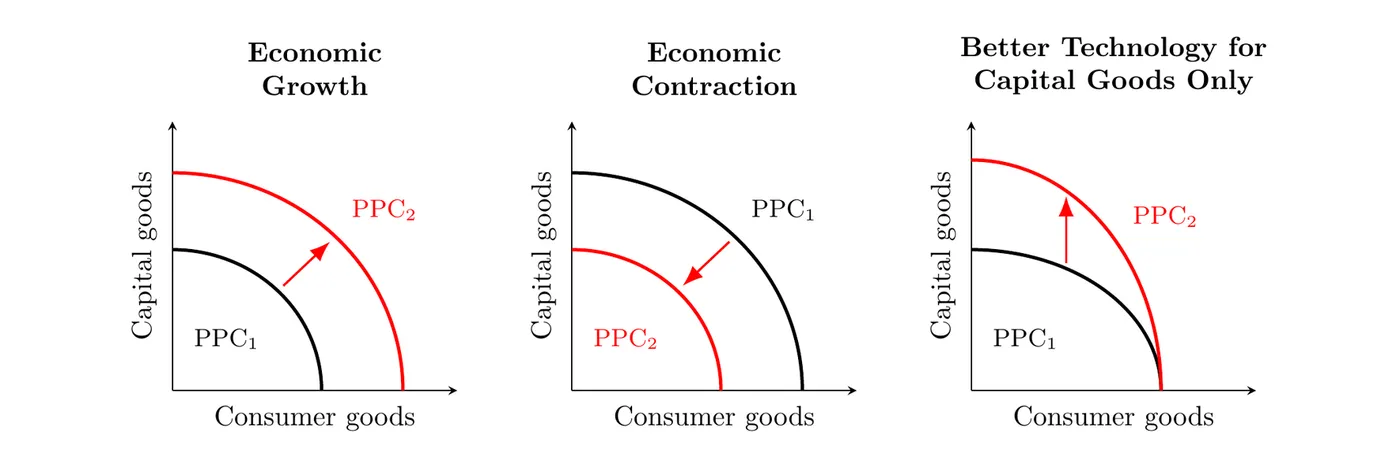
- Economic growth comes from an increase in factors of production (land, labor, capital), which expands what the economy can produce. Think more natural resources, more machinery, better tools, better technology, or a better educated workforce. Growth shifts the whole PPC outward to the right. Increases in productivity, meaning how much a single worker can produce, also drive growth.
- Economic contraction happens when there’s a big drop in factors of production, like a war or disaster destroying resources or costing lives. This shifts the PPC inward to the left.
- Shifts for only one good: if a change only affects how much of one good can be made, only that end of the PPC moves. For example, a new technology that makes machines easier to build pushes the capital goods end of the curve out, while the consumer goods end stays put, since the most consumer goods the economy can make hasn’t changed.
- Capital goods today, growth tomorrow: an economy that puts more of its resources into capital goods now (factories, machines, tools) gives up some consumer goods today. But that new capital adds to its factors of production, so its PPC shifts out further in the future. An economy that chooses mostly consumer goods gets more to enjoy now but grows more slowly.
The Shape of the PPC and Opportunity Costs
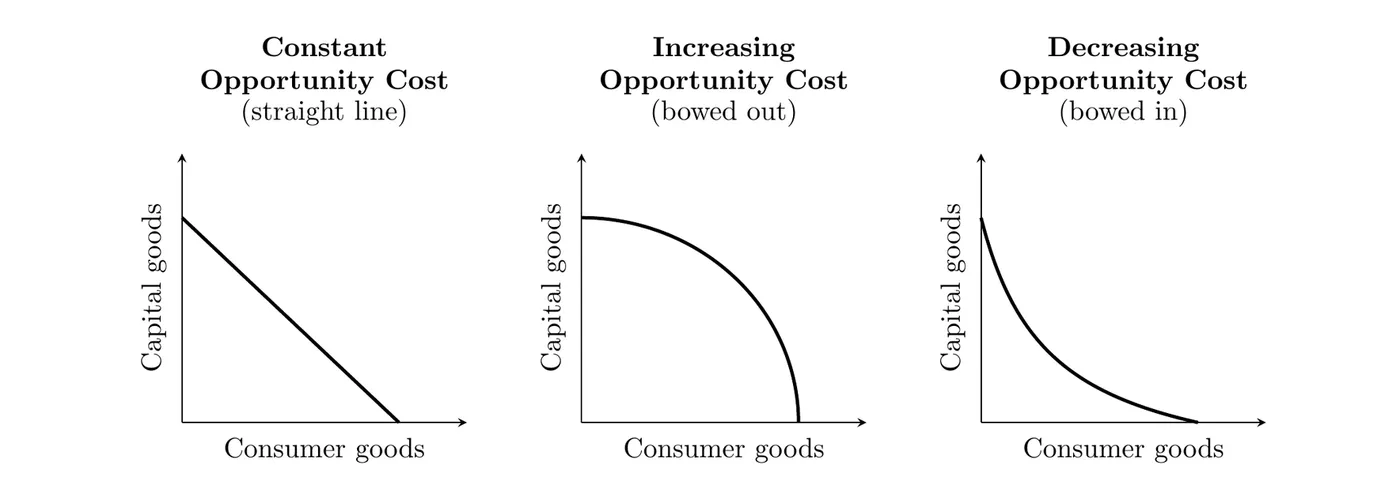
The PPC can be linear, concave (bowed outward), or convex (bowed inward), and the shape tells you whether opportunity costs are constant, increasing, or decreasing.
- Linear PPC: constant opportunity cost. The cost stays the same no matter where you are on the curve.
- Concave (bowed outward) PPC: increasing opportunity cost. As production shifts, the cost of gaining more of one good keeps rising, because resources good at making one thing aren’t necessarily good at making the other. If an economy is heavily specialized in one good, say computers, and switches its best engineers over to making pizza instead, you get a huge drop in computer output for a comparatively small gain in pizza.
- Convex (bowed inward) PPC: decreasing opportunity cost. The more consumer goods you make, the less you have to give up in capital goods. This shape is the least common in the real world.
Takeaway
The PPC shows how scarcity forces choices, which create trade-offs and opportunity costs, all while an efficient economy operates right on the curve. Points inside the curve mean wasted resources, points outside mean impossible combinations (for now), and growth shifts the whole curve outward through more resources or better productivity. The curve’s shape tells you whether opportunity costs stay flat, rise, or fall as production shifts.