

1.3 - Production Possibilities Curve
Here we define the Production Possibilities Curve (PPC) and see how it maps out every combination of two goods a producer can make with fixed resources. We also cover trade-offs, opportunity costs, efficiency versus inefficiency, and what makes the curve shift.
What the PPC shows
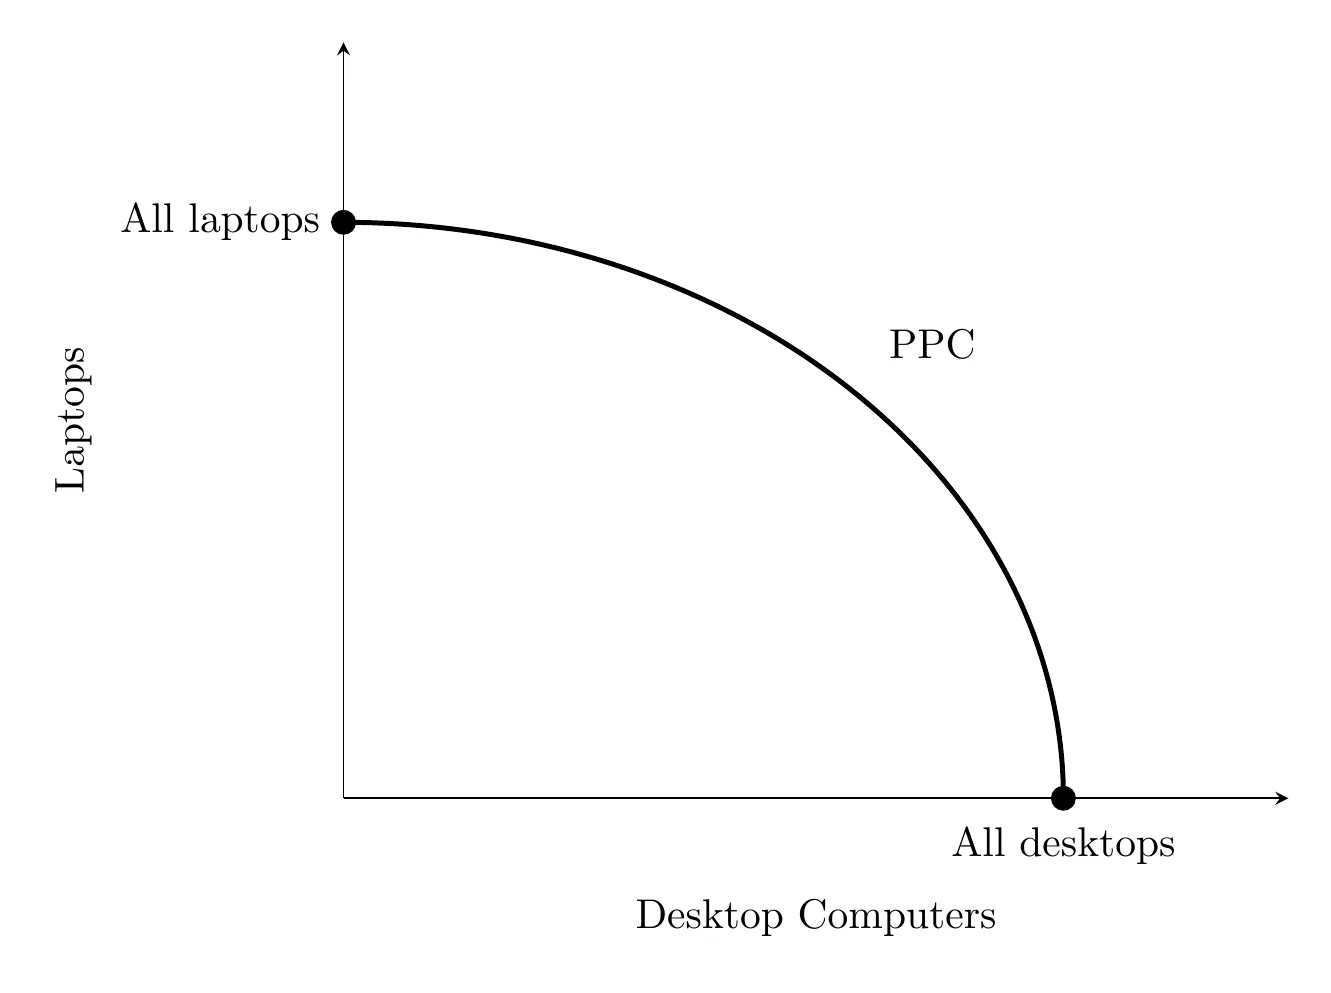
The PPC graphs every possible combination of two goods (or categories of goods) that something can produce when resources are fixed. Since labor, land, and capital are all limited at any given moment, producing more of one good means producing less of the other.
Opportunity cost and curve shape
Opportunity cost is what you give up to make a choice, and on a PPC that shows up as how much of one good you sacrifice to get more of the other.
To calculate it from a PPC or a table, divide what you give up by what you gain:
Say an economy can make these combinations of desktops and laptops:
Point | Desktops | Laptops | Laptops given up for that desktop |
A | 0 | 15 | n/a |
B | 1 | 14 | 1 |
C | 2 | 12 | 2 |
D | 3 | 9 | 3 |
E | 4 | 5 | 4 |
F | 5 | 0 | 5 |
Each extra desktop costs more laptops than the one before (1, then 2, 3, 4, and 5), so this PPC has increasing opportunity cost. When a move covers more than one unit, divide: going from B to D gains 2 desktops and gives up 5 laptops, so each desktop costs laptops. It works in the other direction too: going from E to D gains 4 laptops by giving up 1 desktop, so each laptop costs of a desktop.
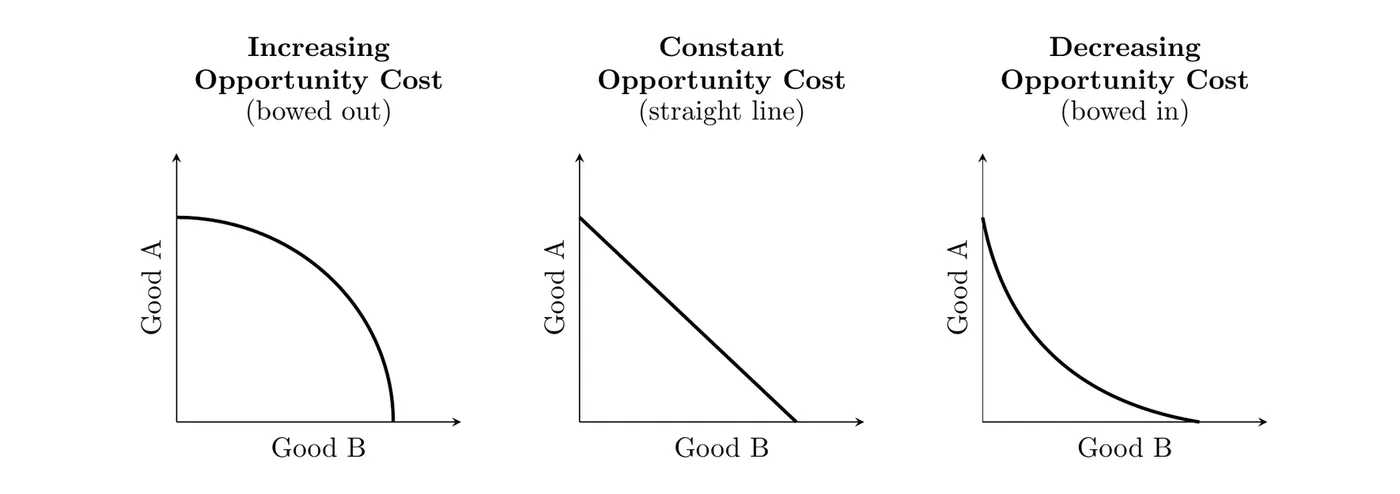
- Increasing opportunity cost (bowed out curve): most PPCs curve this way because resources aren’t perfectly interchangeable. A great coder might be super productive making digital goods, but if you move them into producing physical fruit, they’re much less effective. That’s why costs rise as you push toward the extremes.
- Constant opportunity cost (straight line): this happens when resources are perfectly adaptable. If a factory can use the same plastic and machines to make either blue pens or red pens with equal ease, the cost of switching stays the same no matter what.
- Decreasing opportunity cost (bowed in curve): this one is rare. It happens when making more of a good makes each extra unit cheaper to produce, for example when a factory gets faster and better the more it specializes (economies of scale). Each additional unit of one good costs less and less of the other, so the curve bows in toward the origin.
Efficiency and where you sit on the curve
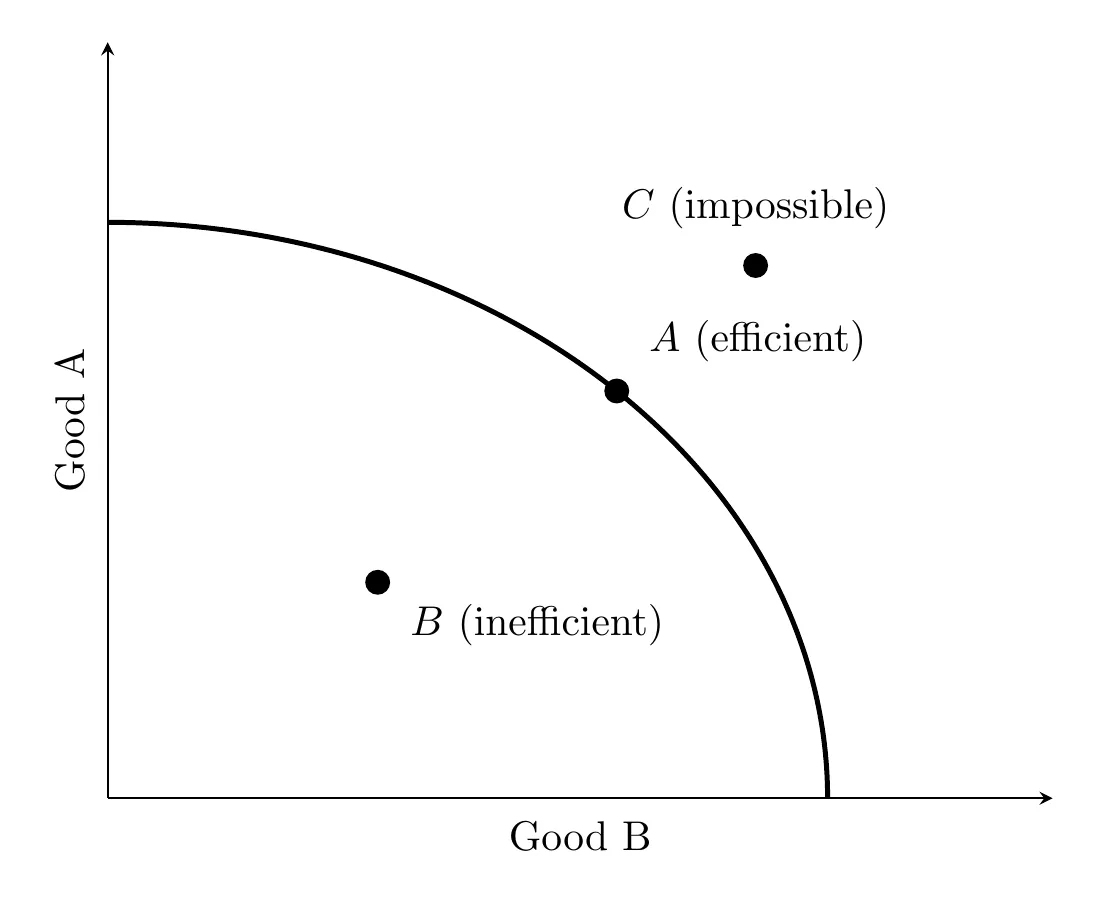
- A point exactly on the curve is productively efficient (in macro terms, full employment).
- A point inside the curve means resources are sitting idle or being used poorly, basically a recession with high unemployment.
- A point outside the curve is currently impossible because there aren’t enough resources to get there yet.
The curve itself is a picture of scarcity: everything beyond it is out of reach with today’s resources. And while every point on the curve is productively efficient (nothing wasted), they aren’t all equally good. The one point that matches the mix of goods society wants most is allocatively efficient.
What shifts the curve
- Shift outward (growth): more resources, a bigger labor force, better capital, or improved human capital (skills and knowledge).
- Shift inward: a shrinking economy, often from a disaster that wipes out land, labor, or capital.
- Technological change (the “kick out”): if new tech only improves production of one good, the curve only pushes out on that one axis, which also changes the opportunity cost of both goods.
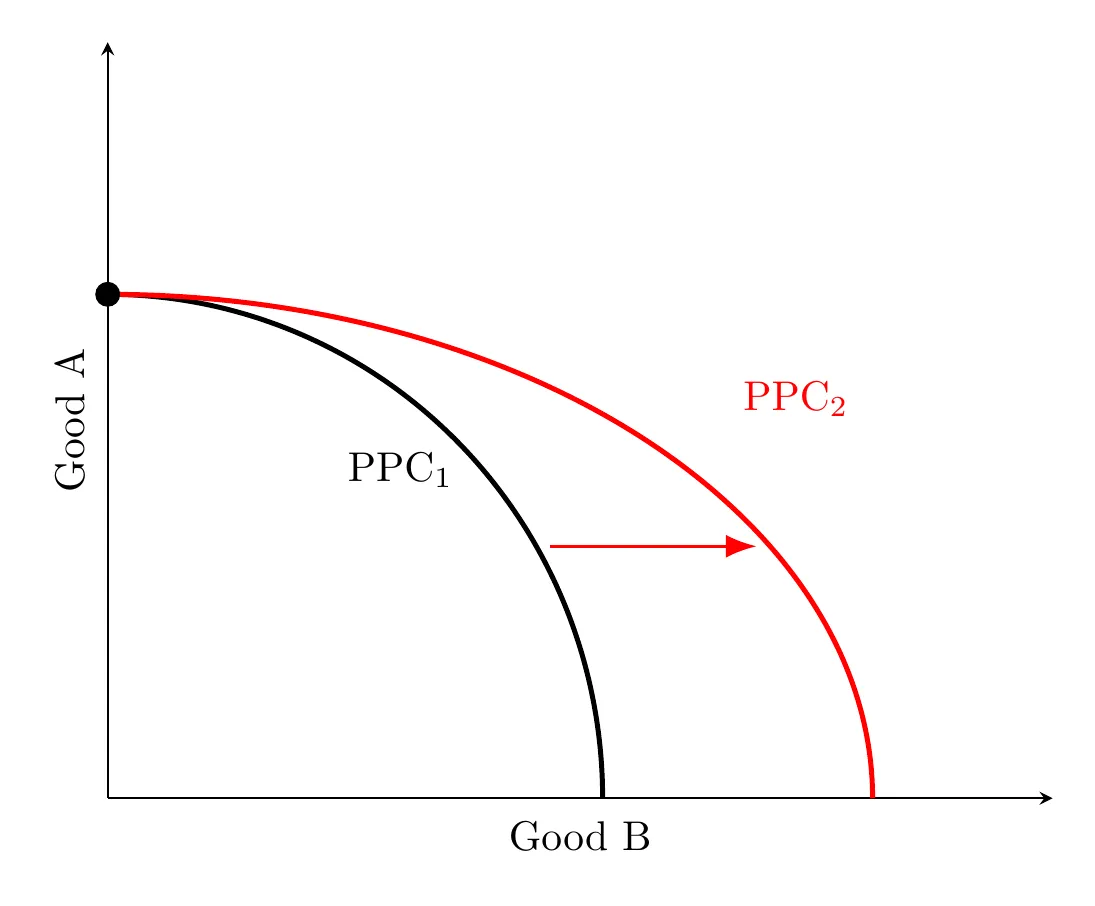
Careful with one common mix-up: unemployment or a recession does not shift the PPC. It moves the economy to a point inside the curve. The curve itself only shifts when the amount or quality of resources changes, or when technology changes.
Capital goods vs. consumer goods
If an economy prioritizes capital goods over consumer goods, it grows faster down the road, since it’s building up the capacity to produce more of everything later.
Takeaway
The PPC is basically a visual ledger of what an economy can and can’t do. Every gain in one area, whether that’s consumer tech or industrial machinery, requires giving something up elsewhere (opportunity cost). Sitting right on the curve means the economy is firing on all cylinders, and the long-term goal is usually to push that curve outward through investment in people and technology, turning today’s impossible production levels into tomorrow’s normal.