

3.4/3.5 - Profit
Two Types of Profit
A firm’s success looks different depending on whether you’re viewing it purely financially or through an economic lens.
Accounting profit is the traditional measure used for taxes and financial statements.
Explicit costs are the out-of-pocket expenses, both fixed and variable, like rent, raw materials, and wages.
Economic profit matters more for actual decision-making because it factors in opportunity costs too.
Implicit costs are the hidden costs, the income or value an entrepreneur gives up by running this business instead of doing something else.
Accounting profit leaves out these implicit costs:
- The owner’s time: the salary they could earn working somewhere else.
- The cost of financial capital: the interest the owner’s own money could have earned somewhere else. Putting $50,000 of savings into the business instead of a savings account paying 4% costs $2,000 a year in lost interest.
- Compensation for risk: a new business might fail, so the owner needs an extra return to make taking that risk worth it.
- Owned resources: the rent the owner gives up by using their own building or equipment instead of renting it out.
Example: The Tech Boutique
Say a software engineer leaves a $100,000-a-year job to open a custom computer shop.
- Revenue: $150,000 in total sales
- Explicit costs: $60,000 on parts and rent
- Accounting profit: $150,000 − $60,000 = $90,000
- Economic profit: $90,000 − $100,000 (the implicit cost of the job they left) = −$10,000
Even though the shop looks profitable on paper, the owner is actually taking an economic loss, since they could’ve earned more by staying at their old job.
Normal Profit (Breaking Even)
A normal profit happens when economic profit is exactly zero, meaning accounting profit exactly equals implicit costs. This isn’t a failure. It just means the entrepreneur is doing exactly as well running this business as they would doing the next best thing available to them.
Put another way, normal profit is the accounting profit that just pays the owner for their time, money, and risk. Economists count it as part of the firm’s costs, which is why zero economic profit still means the business is doing fine.
How Firms Respond to Profit
Firms make decisions based on economic profit, not accounting profit, because economic profit compares this business to the owner’s next best option:
- Economic profit (above zero): the owner earns more here than anywhere else. That’s a signal for the firm to stay or expand, and for new firms to enter the market.
- Normal profit (zero): the owner does exactly as well as their next best option, so there’s no reason to enter or leave.
- Economic loss (below zero): the owner could do better elsewhere, so in the long run they’ll leave, even if accounting profit is positive. The tech boutique above shows a $90,000 accounting profit, but its owner would be better off back at the $100,000 job.
Profit Maximization Strategies
The Total View
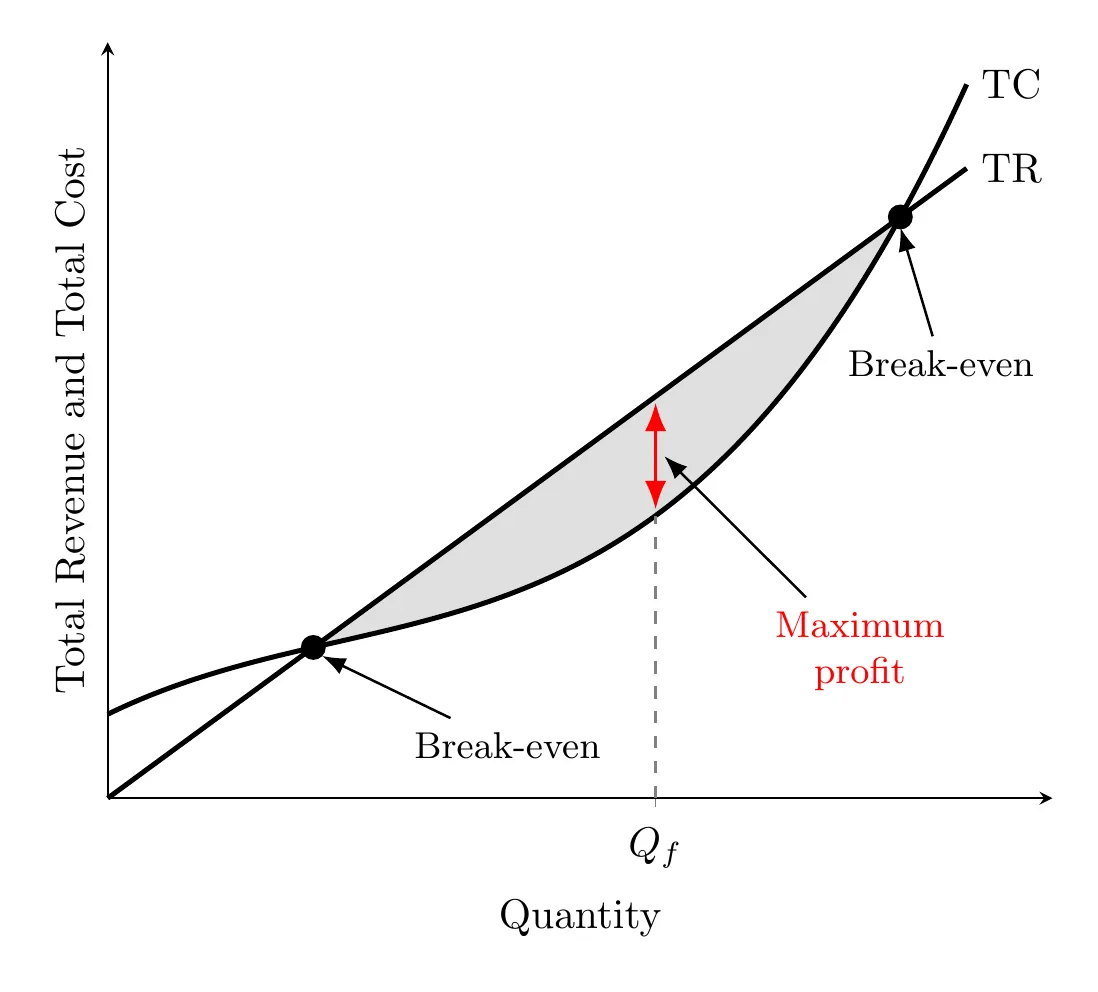
On a graph comparing total revenue (TR) and total cost (TC), profit shows up wherever TR sits above TC.
- Economic loss: TC is above TR.
- Break-even point: where the two curves cross.
- Maximum profit: the quantity where the gap between TR and TC is widest.
The Marginal View (the golden rule)
Most firms don’t think in totals, they use marginal analysis to decide whether the next unit is worth making.
- Marginal Revenue (MR): the extra revenue from selling one more unit, .
- Marginal Cost (MC): the extra cost of producing that unit.
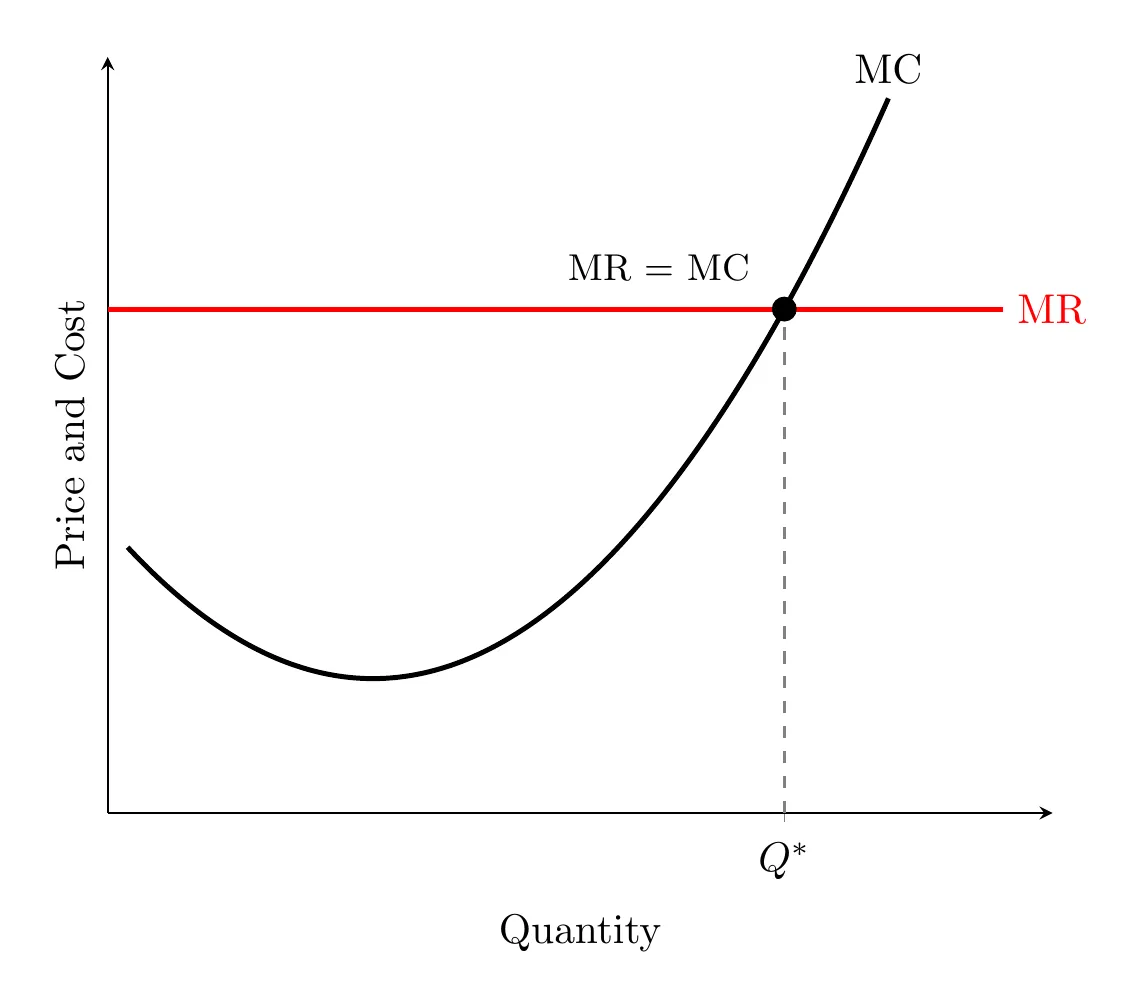
The rule: produce up to the point where MR = MC.
- If MR > MC, produce more, since that next unit adds more revenue than cost.
- If MR < MC, produce less, since that last unit cost more than it brought in.
- Right where MR equals MC is the profit-maximizing (or loss-minimizing) quantity.
- On a graph, if MC crosses MR twice (MC dips before it rises), the profit-maximizing quantity is where MC crosses MR on its way up.
Example: Finding the Profit-Maximizing Quantity
A firm sells every unit for $10, so MR = $10 for each unit. Its fixed cost is $12. All numbers are in dollars.
Output (Q) | TR | TC | Profit (TR − TC) | MR | MC |
0 | 0 | 12 | −12 | ||
1 | 10 | 20 | −10 | 10 | 8 |
2 | 20 | 23 | −3 | 10 | 3 |
3 | 30 | 27 | 3 | 10 | 4 |
4 | 40 | 33 | 7 | 10 | 6 |
5 | 50 | 40 | 10 | 10 | 7 |
6 | 60 | 51 | 9 | 10 | 11 |
- Units 1 through 5 each add more to revenue ($10) than to cost (an MC of $8 or less), so making each one raises profit.
- Unit 6 adds $10 of revenue but $11 of cost, so making it would cut profit by $1 (from $10 to $9).
- So the firm makes 5 units and earns the highest profit in the table: $50 − $40 = $10. With a table, MR rarely equals MC exactly, so keep producing as long as MR is at least as big as MC for the next unit.
Bottom line: to see a firm’s real financial health, you have to look past accounting profit and include implicit opportunity costs, that’s what reveals economic profit. And no matter the market structure, competitive firm or monopoly, maximizing profit always comes down to that same balancing point: MR = MC.