

3.3 - Short-Run Aggregate Supply (SRAS)
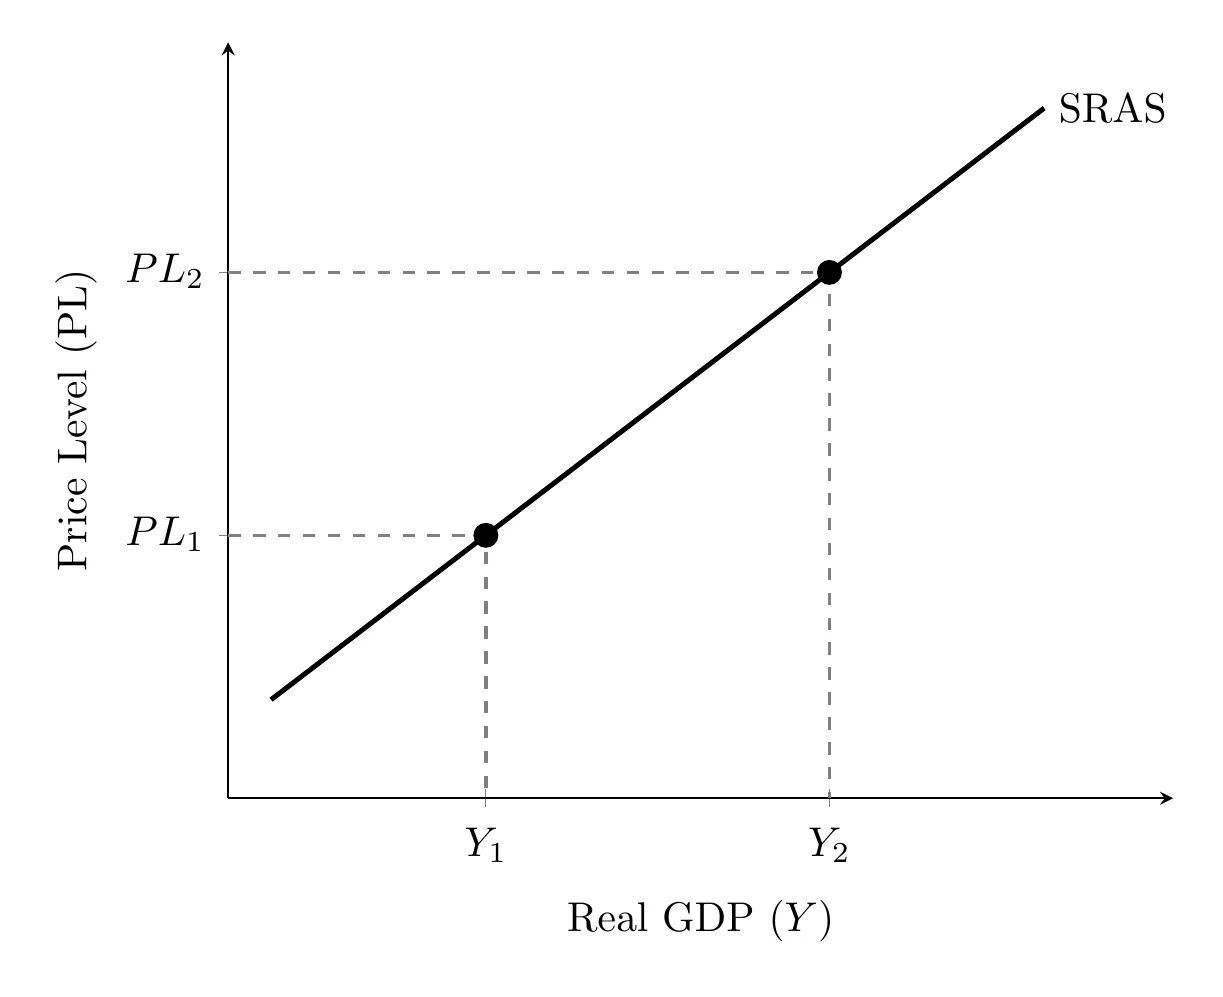
The SRAS Curve
SRAS represents the supply side of the economy and slopes upward, showing a positive relationship between the price level and quantity supplied. Sellers are willing to sell more when prices are higher. As the economy moves up the curve, output rises and unemployment falls, since more workers are needed to produce more. This shows a short-run trade-off between inflation and unemployment.
This assumes the size of the labor force stays the same. If more people are working out of the same labor force, the unemployment rate has to fall. So in the short run, a higher price level (more inflation) goes along with lower unemployment, a trade-off that shows up again as the short-run Phillips curve in Unit 5.
The Short Run and Sticky Wages
The short run is the period where production costs, including wages, are fixed. When the overall price level rises, a firm has a profit incentive to produce more, and it can do so because its costs, especially wages, stay fixed in the short run. This is called sticky wages: nominal wages are slow to fall even during high unemployment, and slow to rise even during low unemployment. This stickiness is exactly what makes the SRAS curve slope upward.
Wages aren't the only sticky cost. Many other input prices, like rent and prices set in supplier contracts, are locked in for a while too (sticky prices). So when the price level rises, the prices firms get for their output rise faster than their costs, and producing more becomes profitable. Sticky wages and sticky input prices together give SRAS its upward slope.
Shifters of the SRAS Curve
There are five shifters, but the two most important are nominal wages and inflationary expectations.
- Nominal wages: rising wages shift SRAS left (firms can’t afford as many workers); falling wages shift it right.
- Inflationary expectations: expecting higher inflation pushes wage demands up, shifting SRAS left; expecting lower inflation shifts it right.
- Resource prices (like oil): higher prices shift SRAS left; lower prices shift it right.
- Government policy toward businesses: higher taxes or tighter regulation shift SRAS left; subsidies or tax cuts shift it right.
- Productivity and technology: more productivity shifts SRAS right; less productivity shifts it left.
All five shifters come down to one idea: anything that changes production costs shifts SRAS. Higher costs per unit of output shift it left, and lower costs per unit shift it right. A change in the price level alone doesn't shift SRAS; it just moves the economy along the curve.
Takeaway
The SRAS curve slopes upward because nominal wages are sticky in the short run, letting firms boost output and profits when prices rise, creating a temporary trade-off between inflation and unemployment. The curve mainly shifts in response to changes in nominal wages and inflationary expectations.