

6.2 - Approximating Areas with Riemann Sums
Introduction
When a curve doesn’t form a nice geometric shape, we can’t use basic area formulas. Instead we approximate the area with rectangles or trapezoids.
To approximate area on using sub-intervals:
where is the width of each sub-interval.
More sub-intervals means a better approximation.
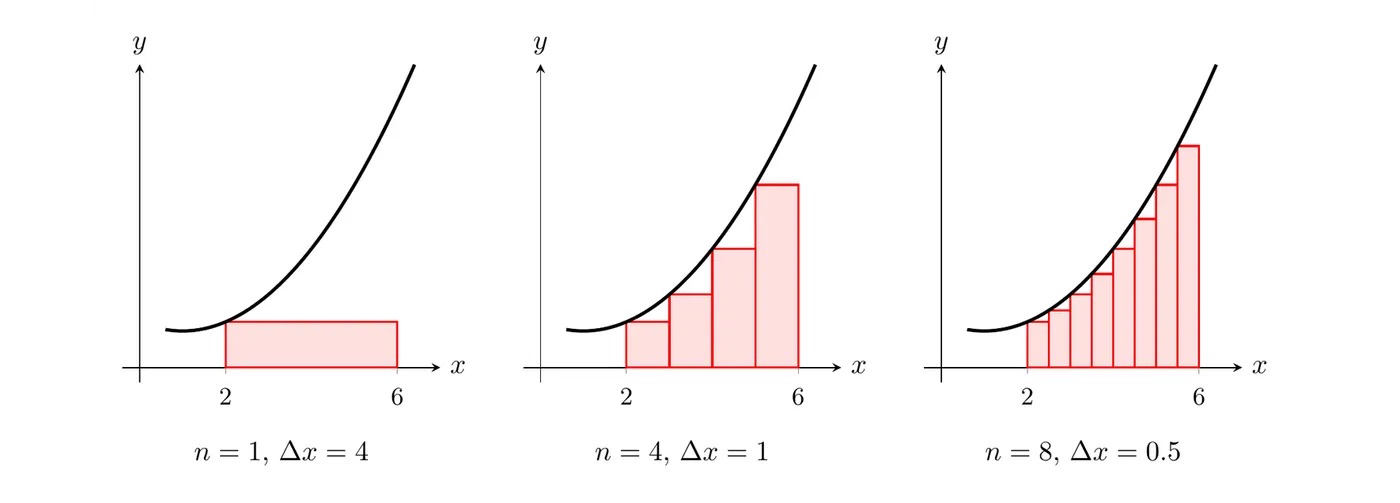
Riemann Sums
A Riemann sum approximates area by adding up the areas of multiple rectangles. It’s named after the German mathematician Bernhard Riemann.
For all four examples below, we’ll use the same function:
Width:
Sub-intervals: , ,
Useful values: , , ,
Left Riemann Sum
Use the left endpoint of each sub-interval for the rectangle height.
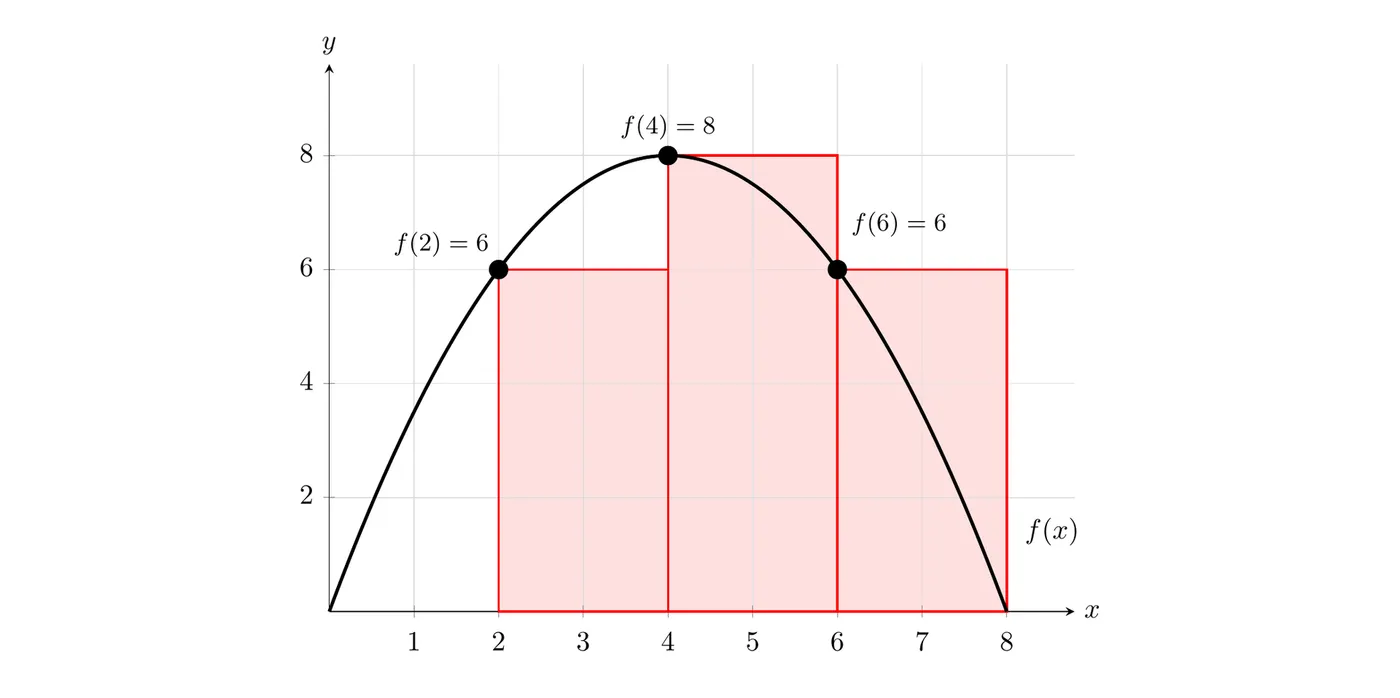
The left Riemann sum approximation is 40 square units.
Right Riemann Sum
Use the right endpoint of each sub-interval for the height.
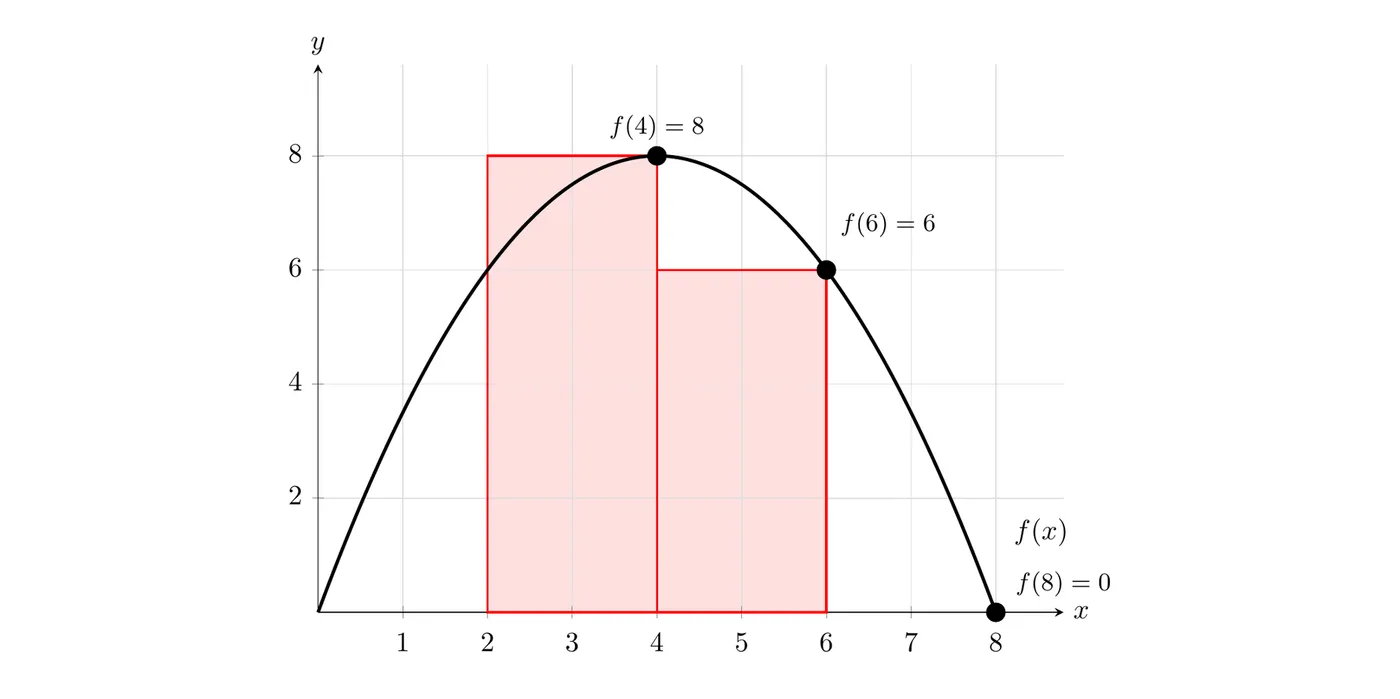
The right Riemann sum approximation is 28 square units. Note that , so the third rectangle has zero height.
Midpoint Riemann Sum
Use the midpoint of each sub-interval for the height. The midpoints here are , , and .
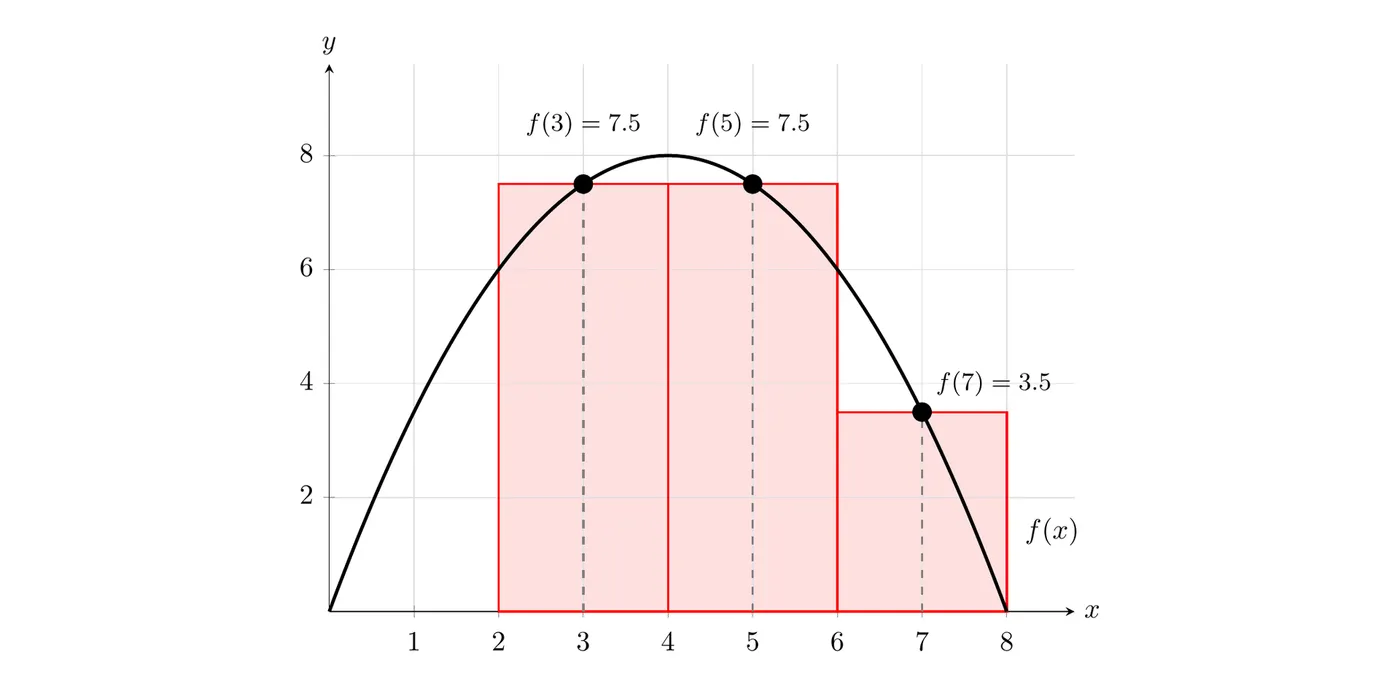
The midpoint approximation is 37 square units, which lands between the left sum (40) and the right sum (28).
Trapezoidal Sum
Use trapezoids instead of rectangles by connecting consecutive function values. A trapezoid has two different heights (the left and right endpoints).
That’s the width times the average of the two heights.
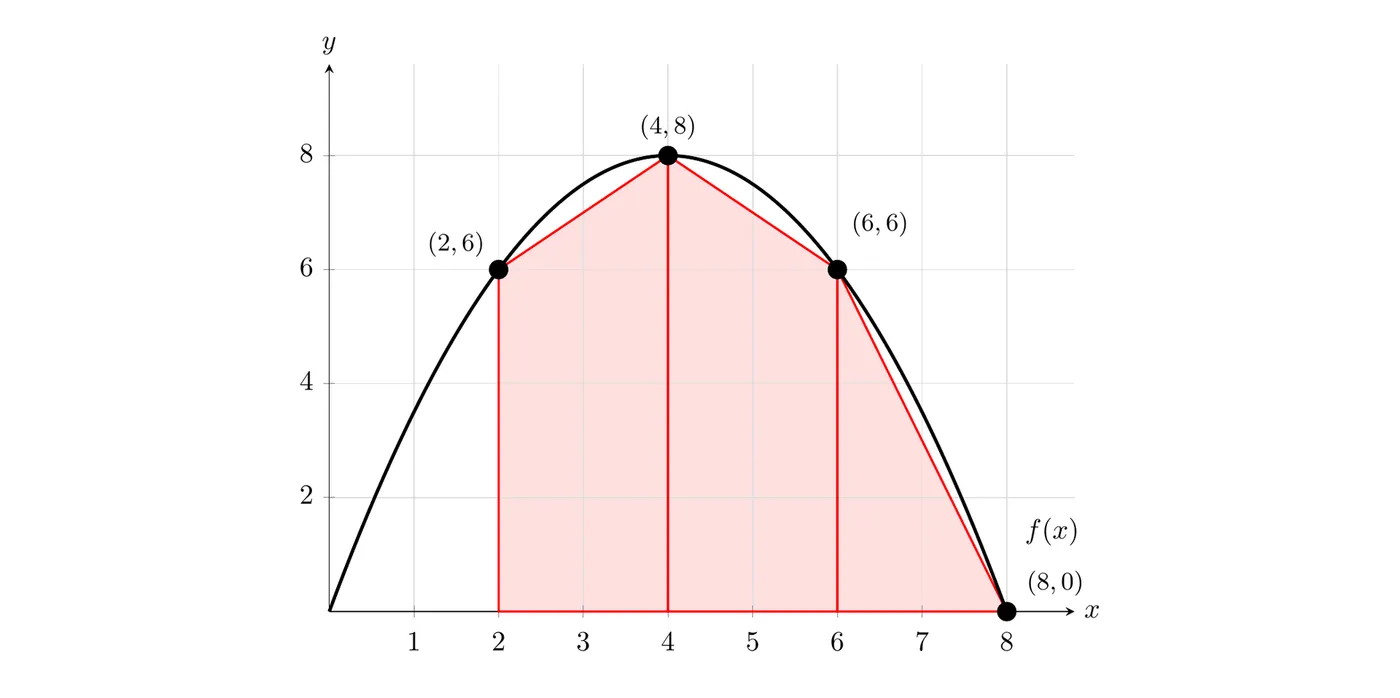
The trapezoidal approximation is 34 square units. The exact area is 36, so here the midpoint sum (37, off by 1) is actually closer than the trapezoidal sum (34, off by 2).
Over-estimates vs. Under-estimates
Whether a Riemann sum is over or under depends on two things: whether the function is increasing or decreasing, and which method you use.
For increasing functions
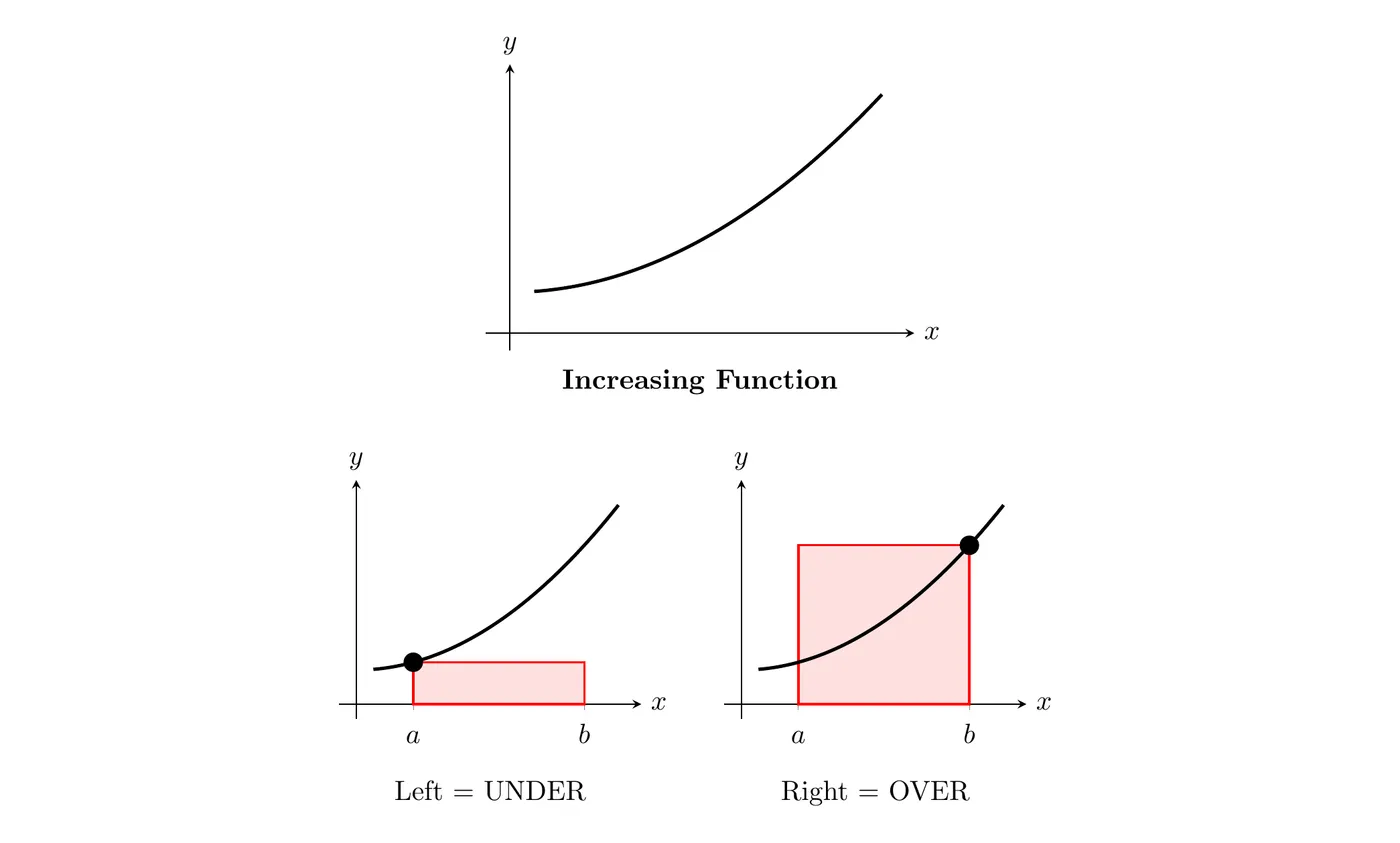
Method | Estimate Type |
Left Riemann Sum | Under-estimate |
Right Riemann Sum | Over-estimate |
For decreasing functions
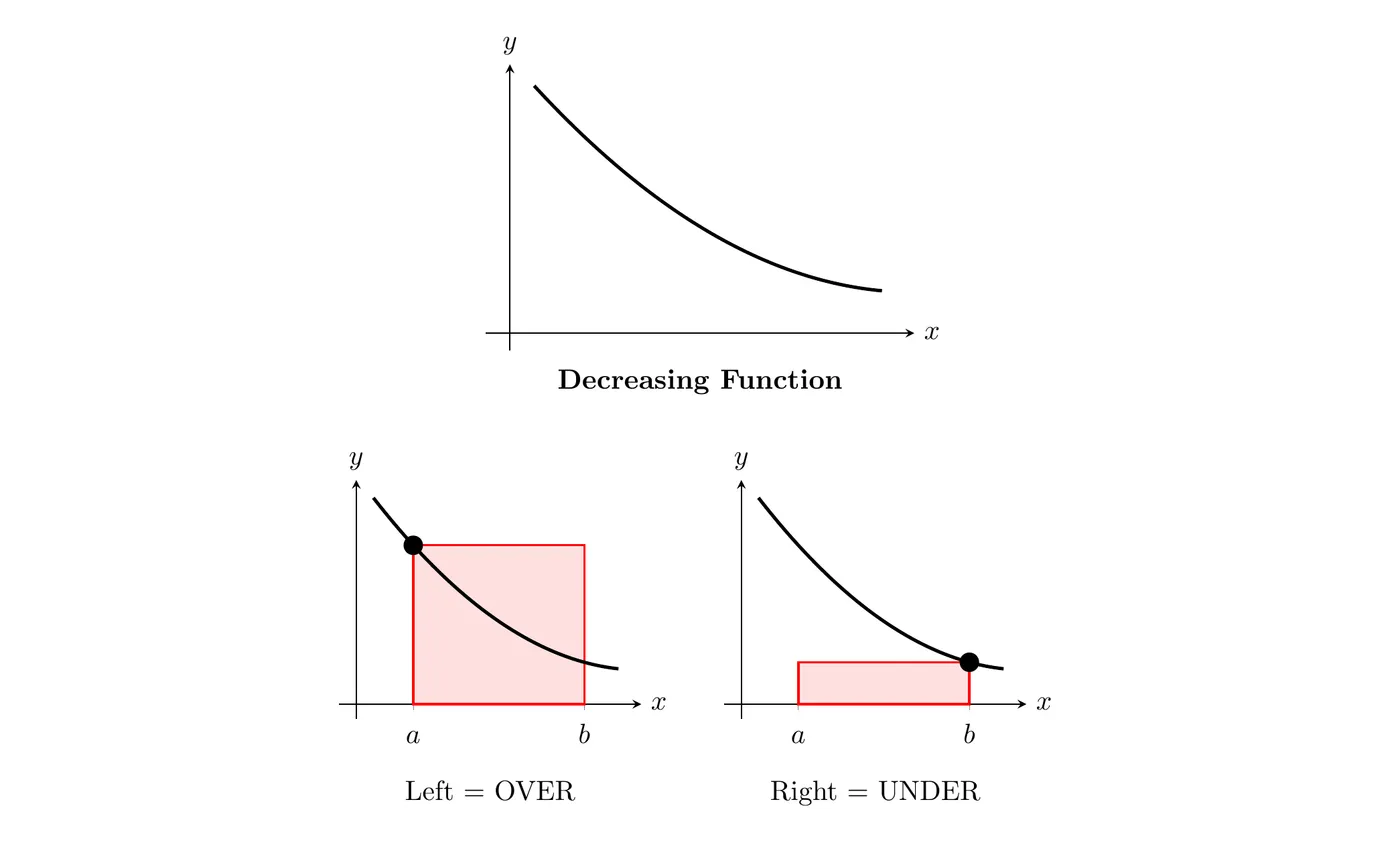
Method | Estimate Type |
Left Riemann Sum | Over-estimate |
Right Riemann Sum | Under-estimate |
For trapezoidal sums, it depends on concavity.
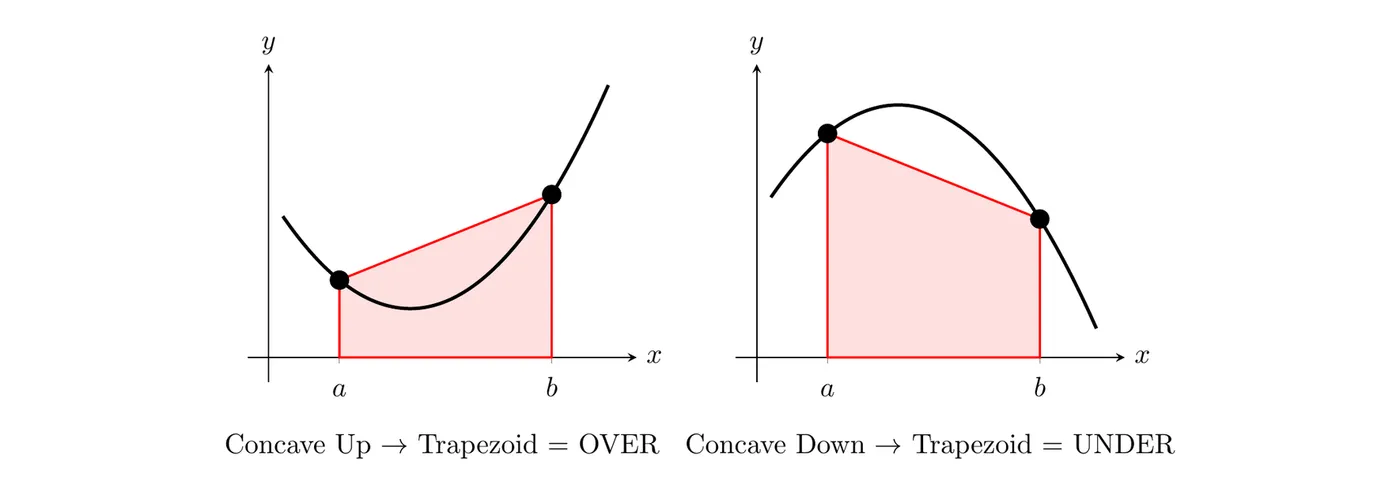
Concavity | Trapezoidal Estimate |
Concave up | Over-estimate |
Concave down | Under-estimate |
Linear (no concavity) | Exact |
For midpoint sums, it also depends on concavity, but the rule is the opposite of trapezoids.
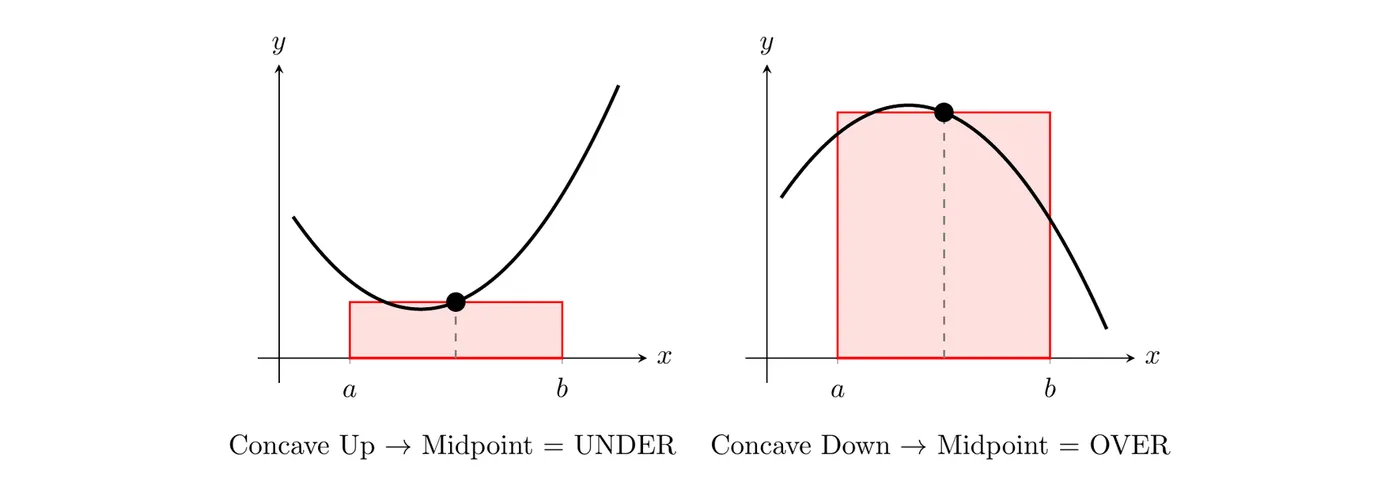
Concavity | Midpoint Estimate |
Concave up | Under-estimate |
Concave down | Over-estimate |
Linear (no concavity) | Exact |
Why? Tilt the top of a midpoint rectangle until it lines up with the tangent line at the midpoint. The area doesn’t change, because the small triangle you cut off on one side is the same size as the one you add on the other. A concave up curve sits above its tangent lines, so the rectangle comes out too small. Concave down is the reverse.
Check with the example above: has , so it’s concave down. The midpoint sum (37) is over the exact area (36), and the trapezoidal sum (34) is under it, just like the tables say.
Memory aid: just sketch a quick picture to figure out over vs. under.
Riemann Sums with Tables of Values
When you’re given a table instead of an equation, use the table values directly.
Example: rate problem with a table
Water is pumped out of a tank at rate in gallons per minute. Approximate the total water pumped in 12 minutes.
(min) | 0 | 3 | 6 | 9 | 12 |
(gal/min) | 7 | 13 | 18 | 23 | 27 |
Note that is increasing throughout.
Right Riemann sum (4 sub-intervals)
Sub-intervals , each with :
Justification: this is an over-estimate because it’s a right Riemann sum on an increasing function.
Left Riemann sum (4 sub-intervals)
Justification: this is an under-estimate because it’s a left Riemann sum on an increasing function.
Midpoint Riemann sum (2 sub-intervals)
Important: you can only use values that appear in the table, so you have to pick sub-intervals whose midpoints are actually there.
Sub-intervals and , each with . Midpoints are and , both in the table.
You couldn’t use sub-intervals like here, because the midpoint isn’t in the table.
Trapezoidal sum (4 sub-intervals)
Comparison
Method | Approximation | Type |
Left Sum | 183 gallons | Under |
Right Sum | 243 gallons | Over |
Midpoint Sum | 216 gallons | Between |
Trapezoidal Sum | 213 gallons | Between |
General Formulas
Left Riemann sum
Right Riemann sum
Midpoint Riemann sum
where is the midpoint of the -th sub-interval.
Trapezoidal sum
Or in the compact form:
Riemann Sums with Unequal Sub-intervals
Everything above used equal widths, but sub-intervals don’t have to be the same size, and tables on the AP exam often have uneven gaps. The rule doesn’t change: each rectangle or trapezoid uses its own width. You just can’t factor out one , and the compact trapezoid formula above doesn’t apply.
Example: a hose fills a pool at a rate of gallons per minute, where is increasing. Approximate the water that flows into the pool from to minutes.
(min) | 0 | 2 | 5 | 6 | 10 |
(gal/min) | 12 | 15 | 20 | 21 | 25 |
The widths are 2, 3, 1, and 4 minutes.
Left Riemann sum
Right Riemann sum
Trapezoidal sum
Since is increasing, the left sum is an under-estimate and the right sum is an over-estimate, so the actual amount is between 173 and 211 gallons.
Key Takeaways
- Width formula: , where is the number of sub-intervals
- More sub-intervals means a better approximation (and more work)
- Left sum: left endpoint of each sub-interval for the height
- Right sum: right endpoint for the height
- Midpoint sum: midpoint for the height
- Trapezoidal sum: average the two endpoint heights
- Increasing function: left is under, right is over
- Decreasing function: left is over, right is under
- Trapezoids: concave up is over, concave down is under
- Midpoints: concave up is under, concave down is over (the opposite of trapezoids)
- Tables: you can only use the values given, so choose sub-intervals carefully for midpoints
- Unequal widths: multiply each height by the width of its own sub-interval
- Midpoint and trapezoidal sums are usually more accurate than left or right sums for the same number of sub-intervals
- Justification: state both the method AND the function’s behavior (increasing/decreasing or concavity)
- Units from a rate: the area gives the accumulation when you start with a rate of change