

6.5 - Interpreting the Behavior of Accumulation Functions Involving Area
Review
Accumulation function:
where is constant and is variable.
Fundamental Theorem of Calculus (Part 2):
And if the upper limit is a function :
Behavior of Accumulation Functions
Since , we can analyze just by looking at .
Property of | Condition on | Equivalent Condition on |
Increasing | ||
Decreasing | ||
Relative maximum | changes to | changes to |
Relative minimum | changes to | changes to |
Concave up | (slope of is positive) | |
Concave down | (slope of is negative) | |
Point of inflection | changes sign | changes sign |
The two relationships that drive everything:
Example 1: Analyzing from the Graph of
Given and the graph of below.
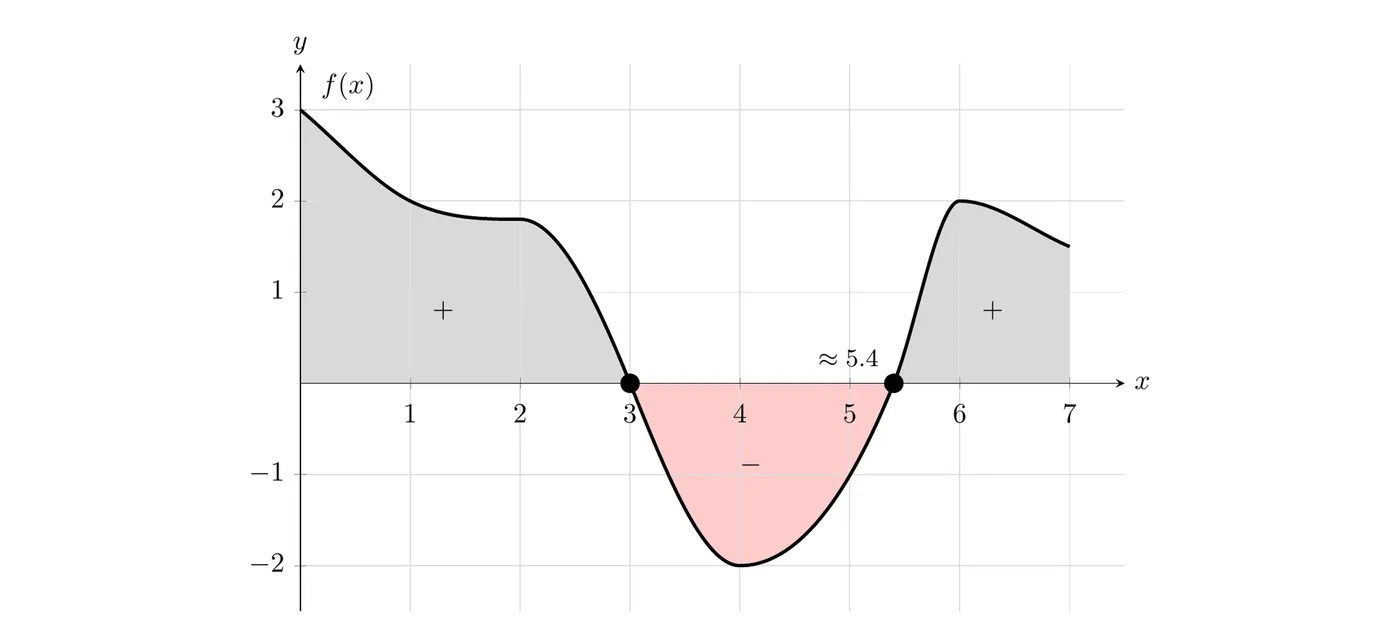
Find the relative minimum of
A relative minimum happens where changes from to . Since , we need to cross from negative to positive.
From the graph, crosses from negative to positive at .
Answer: relative minimum at
Find the relative maximum of
A relative maximum happens where changes from to , so we need to cross from positive to negative.
crosses from positive to negative at .
Answer: relative maximum at
Where is concave up?
Concave up means . Since , we need the slope of to be positive.
The slope of is positive (the graph is rising) on .
Answer: concave up on
Where is concave down?
Concave down means , so we need the slope of to be negative.
The slope of is negative (the graph is falling) on .
Answer: concave down on
Points of inflection of
Points of inflection happen where changes sign, so we need the slope of to change sign.
- At : the slope goes from negative to zero, then back to negative. No sign change.
- At : the slope goes from negative to positive. Sign change ✓
- At : the slope goes from positive to zero, then to negative. Sign change ✓
Both have a genuine sign change in slope.
Answer: points of inflection at
Maximum value of on , given
Strategy:
1. Find where the maximum occurs (already found: )
2. Calculate using
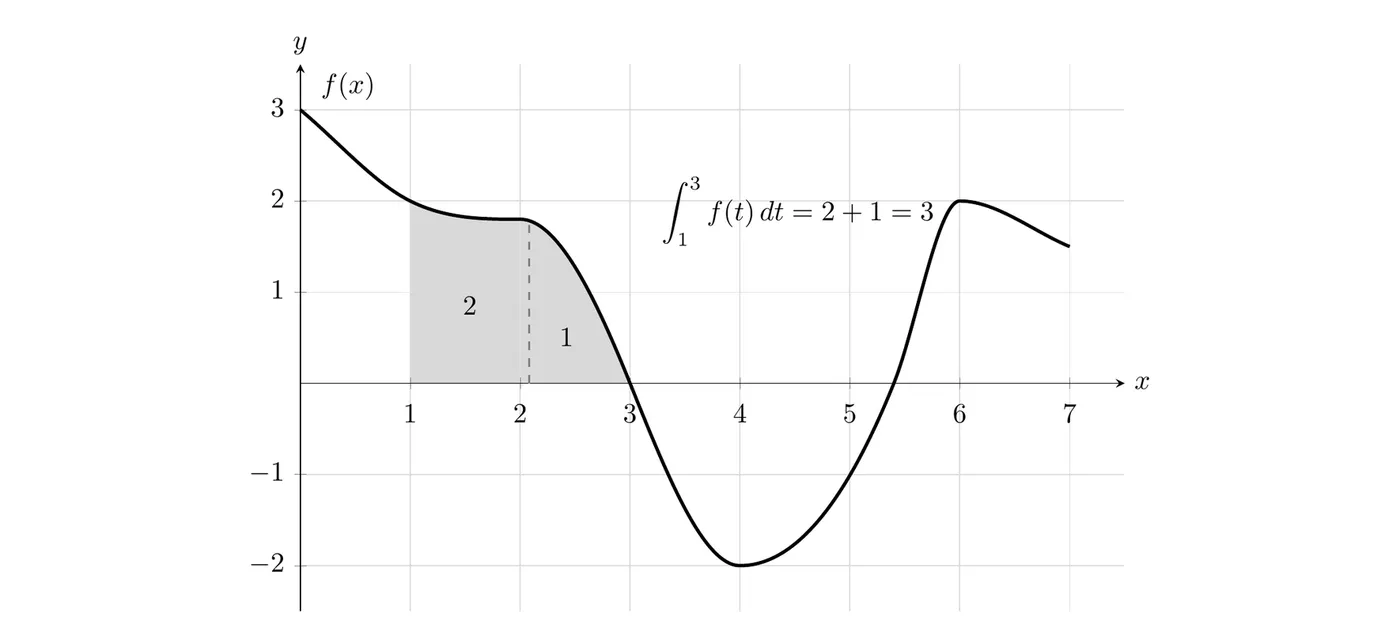
On , is positive (it doesn’t cross the axis until ), and the region breaks into two pieces of area 1 and 2, giving a total area of 3.
Answer: the maximum value of is 8
Example 2: Finding Critical Points Algebraically
Given , where is continuous, for , and for . So crosses from positive to negative at .
Find the -value where has a relative maximum.
Step 1: find using FTC Part 2 with the chain rule:
Step 2: set . For a relative maximum, has to change from to , which happens when:
Step 3: solve for . We know changes from positive to negative at , so set the argument equal to 3:
Answer: has a relative maximum at
Verification:
- For : , so is positive (before its sign change), meaning ✓
- For : , so is negative, meaning ✓
- The sign change from to confirms a relative maximum ✓
Example 3: Working from a Table of Values
Let , where is continuous. Selected values of are in the table.
1 | 3 | 4 | 7 | |
6 | 2 |
Find
, since an integral from a number to itself is 0.
Is increasing or decreasing at ?
, so is increasing at .
Must have a critical point between and ?
Yes. is continuous, , and , so by the Intermediate Value Theorem, for some in . Then , so has a critical point at .
Approximate with a trapezoidal sum.
The sub-intervals have widths 2, 1, and 3:
Strategy Summary
To analyze :
Increasing/decreasing
- is increasing where (above the x-axis)
- is decreasing where (below the x-axis)
Extrema
- Relative max where crosses from to
- Relative min where crosses from to
Concavity
- is concave up where the slope of is positive
- is concave down where the slope of is negative
- Point of inflection where the slope of changes sign
Finding values
- Use
- Find the area under from to , then add it to the known value at
When the upper limit is a function
1. Find
2. Set it equal to zero, so
3. Set equal to the known zeros of and solve
4. Verify the sign change to determine max vs. min
Key Takeaways
- Fundamental relationship: if , then and
- Increasing/decreasing: analyze the sign of directly
- Extrema: look for where crosses the x-axis
- Concavity: look at the slope of
- Points of inflection: find where the slope of changes sign
- Finding values:
- With a function upper limit: set the argument equal to known features of and solve
- This is Unit 5 material applied. Same concepts, just with an integral defining the function
- The graph of tells the story of : positive means is increasing, negative means is decreasing