

6.1 - Exploring Accumulations of Change
Understanding “Area Under the Curve”
Important definition: “area under the curve” means the area between the function and the x-axis, not just the area below the function.
The region is bounded by:
1. The curve
2. The x-axis
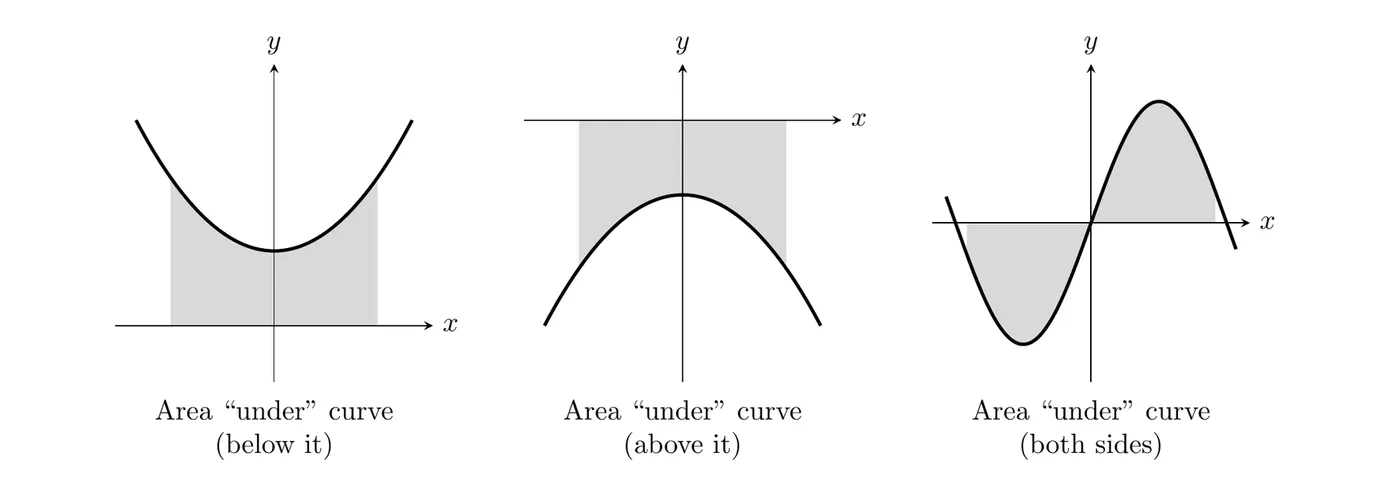
The phrase “under the curve” is a little misleading. It doesn’t mean “below” in a spatial sense. It means “between the curve and the x-axis.”
Accumulation from Rates of Change
Here’s the fundamental idea: if a function represents a rate of change, then the area under the curve gives the accumulation of change.
Simple example: constant speed
Drive at a constant 60 mph for 4 hours.
Traditional calculation:
Area interpretation:
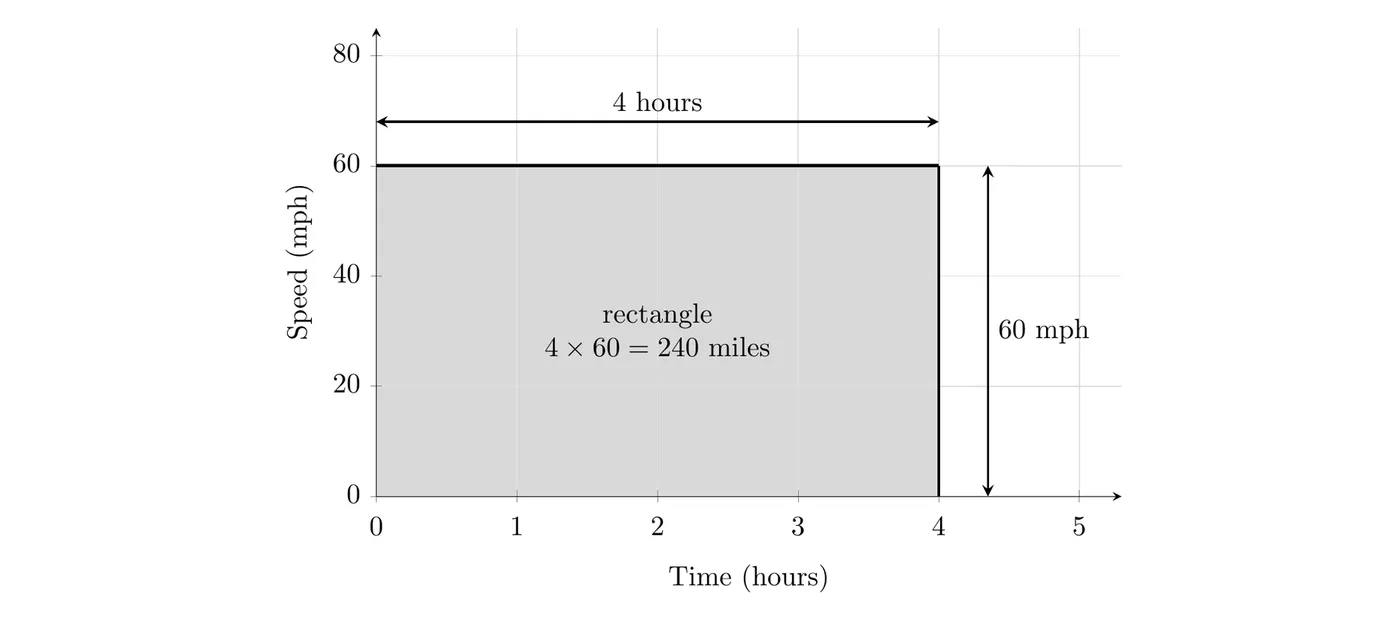
The area is the total distance traveled, the accumulation of the rate of change.
Units for Area Under a Curve
Or equivalently, (dependent variable units) × (independent variable units).
Speed and time:
The hours cancel, leaving miles (distance).
Flow rate and time:
The minutes cancel, leaving gallons (total volume).
Example 1: Water Leaking from a Tank
Water leaks from a tank at varying rates. The graph shows the leak rate in gallons per minute over 9 minutes.
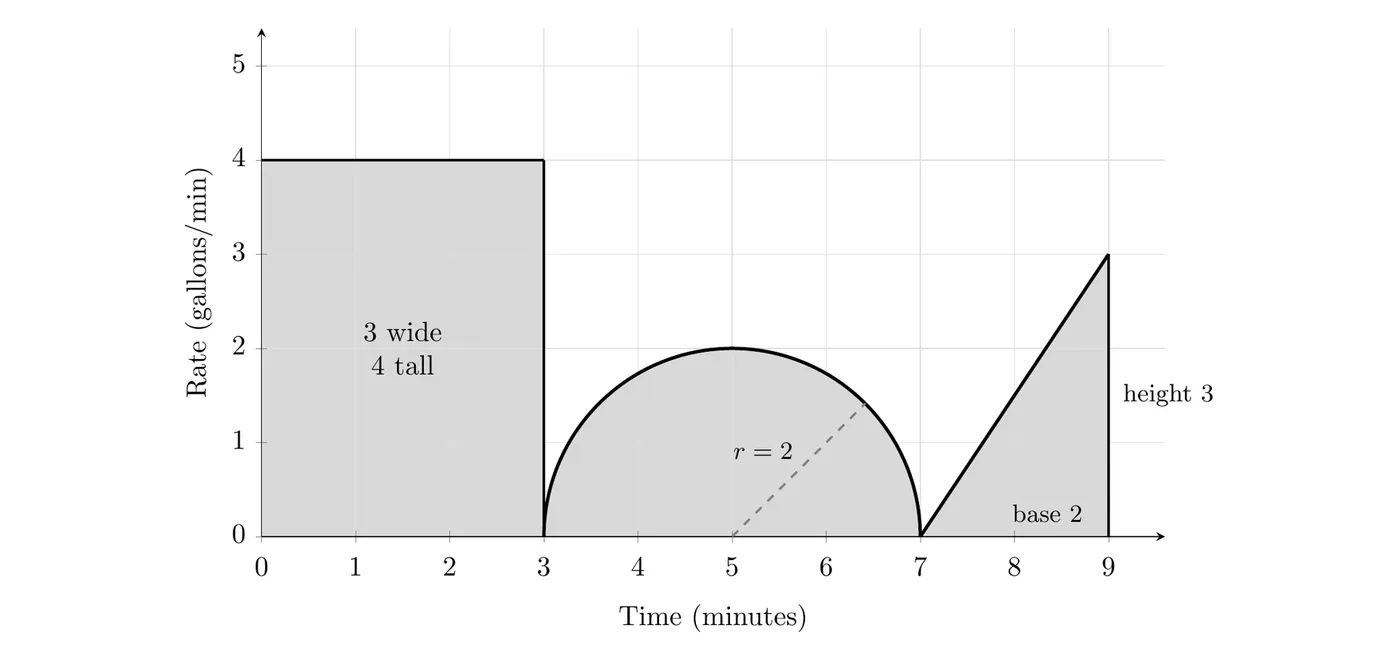
Find the total water leaked in 9 minutes. Just find the area of each geometric shape.
Rectangle (0 to 3 minutes):
Semicircle (3 to 7 minutes), radius 2:
Triangle (7 to 9 minutes), base 2 and height 3:
Total:
That’s the exact answer. Approximately, gallons.
Interpreting the answer in context: on the AP exam, a complete interpretation names the quantity, gives the amount with units, and says the time interval. Here: a total of gallons of water leaked out of the tank during the first 9 minutes.
Example 2: Particle Motion with Direction Changes
A particle moves along the x-axis with the velocity shown below, in cm/s, with time in seconds.
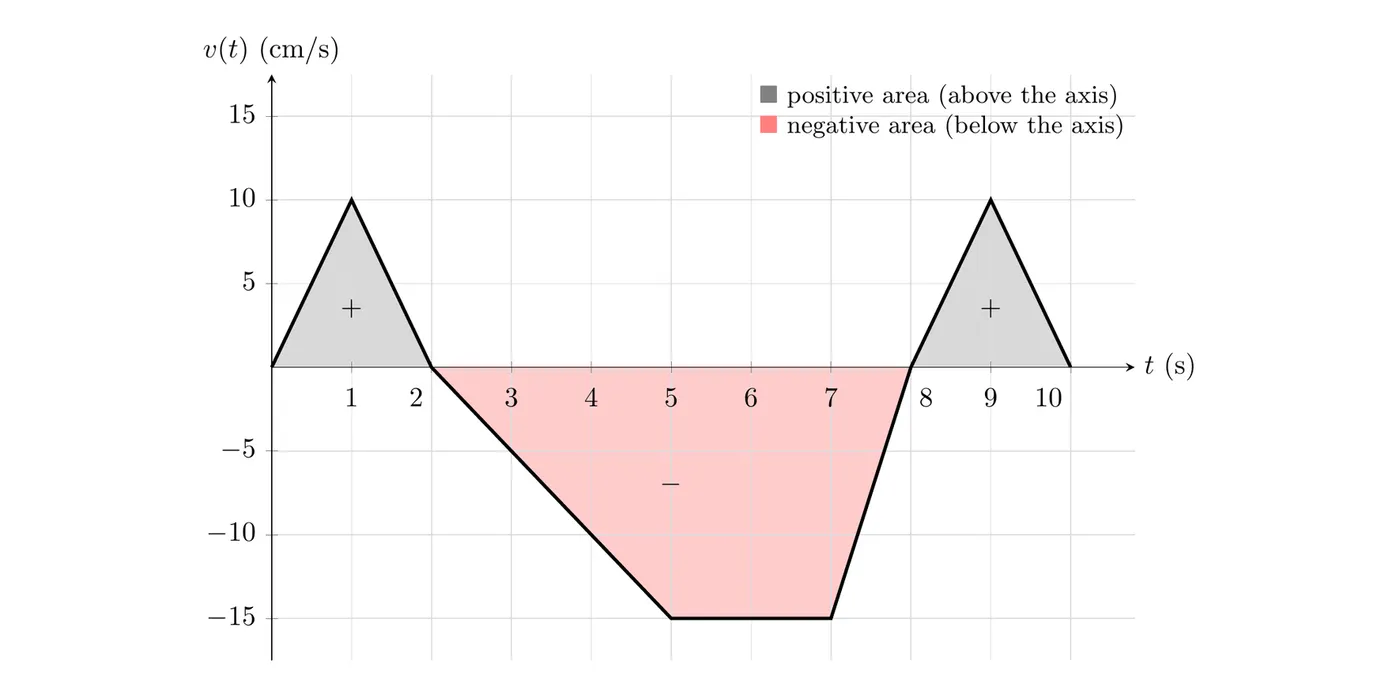
Part A: how far is the particle from its starting position after 10 seconds?
Find each area, keeping track of signs.
Region 1 (0 to 2 s, above axis): triangle, base 2, height 10
Region 2 (2 to 5 s, below axis): triangle, base 3, height 15
Region 3 (5 to 7 s, below axis): rectangle, base 2, height 15
Region 4 (7 to 8 s, below axis): triangle, base 1, height 15
Region 5 (8 to 10 s, above axis): triangle, base 2, height 10
Net displacement:
The particle ends up 40 cm to the left of its starting position. The negative sign is direction (left along the x-axis).
Part B: how far did the particle travel between 2 and 8 seconds?
Between and , the particle is moving in the negative direction the whole time (velocity is below the axis).
The particle traveled 60 cm to the left.
Positive vs. Negative Area
Sign convention:
- Area above the horizontal axis: positive
- Area below the horizontal axis: negative
For motion problems:
- Positive area means movement in the positive direction (right, forward, up)
- Negative area means movement in the negative direction (left, backward, down)
Net displacement: add positive areas, subtract negative ones.
Total distance traveled: add the absolute values of all areas, ignoring signs.
Strategy for Geometric Shapes
Shape | Area Formula |
Rectangle | |
Triangle | |
Semicircle | |
Trapezoid |
Tip: break complicated regions into simple shapes, find each area, and add them up.
Key Takeaways
- “Area under curve” means the area between the curve and the x-axis, not necessarily below the curve
- Rate of change function → area gives the total accumulation of change
- Units for area: (y-axis units) × (x-axis units), with the appropriate cancellation
- Positive area: where the curve is above the horizontal axis
- Negative area: where the curve is below the horizontal axis
- Net change: positive areas minus negative areas
- Total amount: sum of the absolute values of all areas
- Geometric shapes: use standard area formulas for rectangles, triangles, circles
- Direction matters: the sign of the area tells you the direction of change in motion problems
- Always include proper units in your final answer