

6.2 - Energy Diagrams
Overview
An energy diagram is a picture of how the energy of a system changes during a process. One glance tells you whether the process is endothermic or exothermic and how big the energy change is. The AP exam asks you to read these diagrams and to draw them, for chemical reactions and for physical changes like melting and dissolving.
What an energy diagram shows
- Vertical axis: the energy of the system, labeled potential energy or enthalpy (). Higher means more energy stored in the particles' bonds and attractions. When a scale is given, the units are usually (kilojoules per mole of reaction as written).
- Horizontal axis: reaction progress (also called the reaction coordinate). It shows the order of events, from reactants on the left to products on the right. It is not time, and it has no units.
- Reactant and product levels: flat lines showing the energy of the starting and ending substances.
- : the vertical distance between the two levels, drawn as an arrow that starts at the reactants and points to the products.
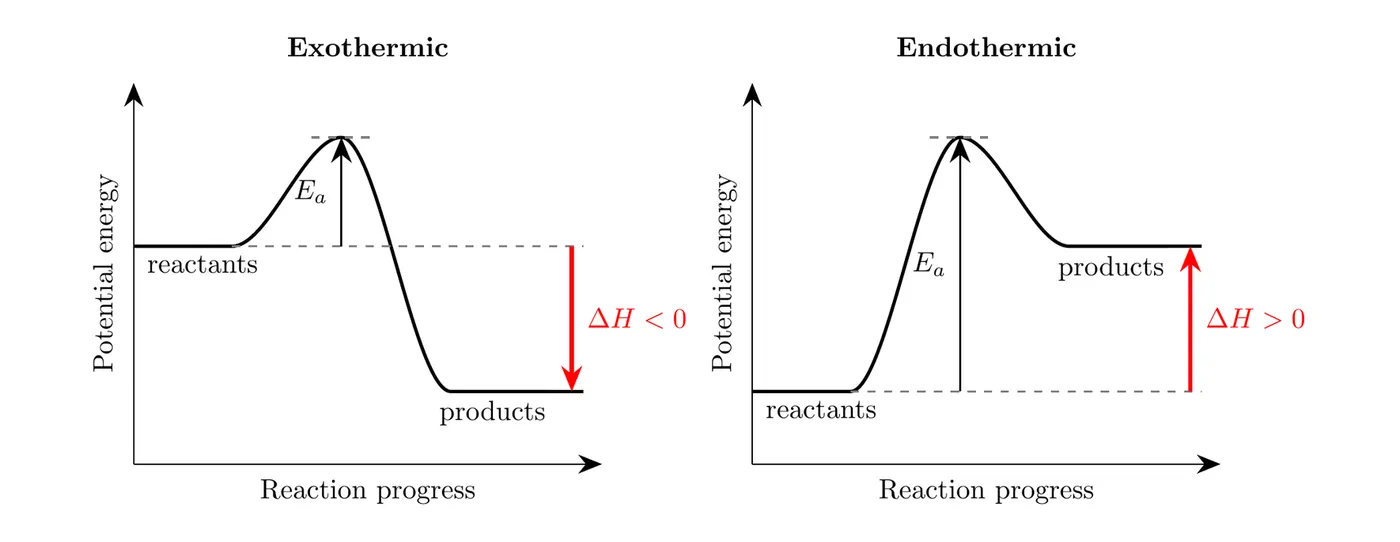
Exothermic: the products sit lower than the reactants. The arrow points down and . The energy the system loses is released to the surroundings.
Endothermic: the products sit higher than the reactants. The arrow points up and . The extra energy the products hold was absorbed from the surroundings.
The hump
Reaction profiles like the ones above have a hump between reactants and products. Its height above the reactants is the activation energy, , from Topic 5.6. The hump controls how fast a reaction goes, while depends only on where the reactants and products sit. A catalyst lowers the hump but doesn't move either level, so it doesn't change .
Simple level diagrams
Often you only need the two levels and the arrow, with no hump. That's the usual way to draw physical changes (melting, boiling, dissolving), and it works for reactions too. Write each substance with its phase, since and have different energies.
Drawing an energy diagram
- Write the reactants (with phases) on one level and the products on the other.
- Decide which level is higher. Exothermic: products lower. Endothermic: products higher.
- Draw the arrow from the reactants to the products, and label it with its sign, value, and units.
- Label the vertical axis (energy or enthalpy). If you're given numbers, place the levels so the gaps match them. When two processes share one diagram, use one scale, so a bigger is a longer arrow. Correct scale and units are what AP skill 3.A asks for. The water diagram in 6.5 is drawn this way.
Reversing a process flips the arrow. The levels don't move, so the reverse process has a of the same size and the opposite sign. If melting ice has kJ/mol, freezing water has kJ/mol.
Example 1: Combustion of methane
Natural gas is mostly methane. Draw an energy diagram for its combustion:
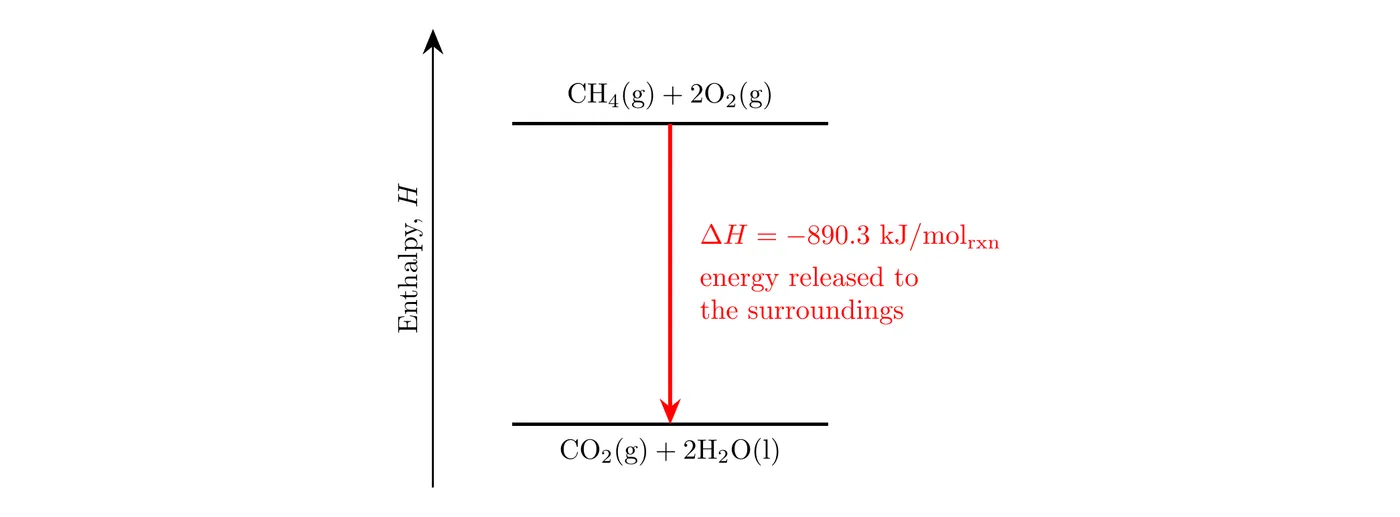
is negative, so the reaction is exothermic and the products go below the reactants. The arrow points down from to . For every mole of reaction as written (1 mol of burned), 890.3 kJ is released to the surroundings.
Example 2: Dissolving ammonium nitrate
Dissolving ammonium nitrate is the process inside an instant cold pack:
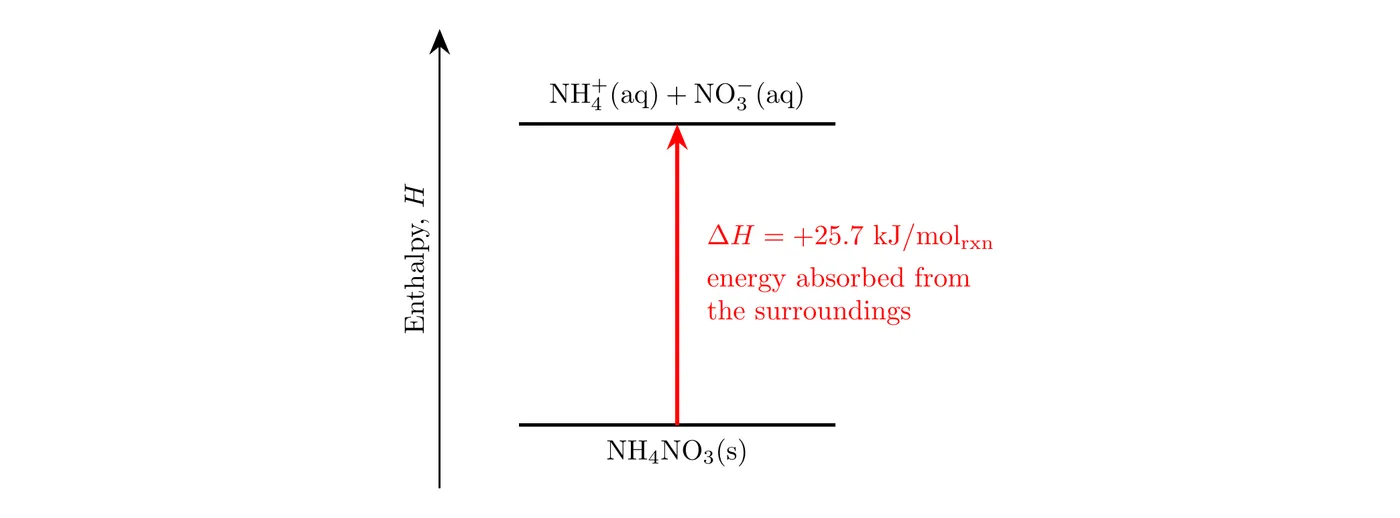
This is a physical change, but it gets a diagram the same way. is positive, so the dissolved ions sit above the solid and the arrow points up. The 25.7 kJ for each mole dissolved comes from the surroundings, which is why the pack gets cold.
Example 3: Reading a diagram (AP-style)
The diagram shows the potential energy for the reaction .
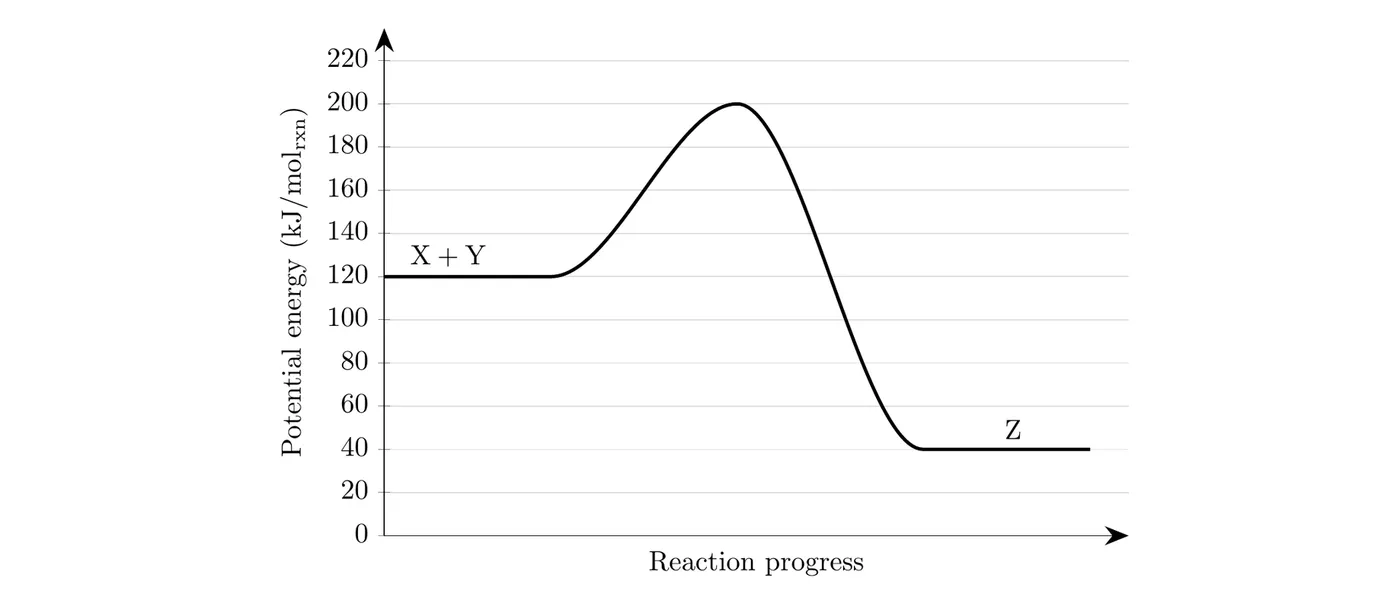
(a) Is the reaction endothermic or exothermic? Justify your answer. (b) Find . (c) What is for ? (d) A catalyst is added. Describe how the diagram changes.
(a) The product, Z, is at 40 , lower than the reactants, X + Y, at 120 . The system ends with less energy than it started with, so energy was released to the surroundings. The reaction is exothermic.
(b)
(c) Reversing the reaction flips the sign: , so the reverse reaction is endothermic.
(d) The peak gets lower (a smaller activation energy, so the reaction goes faster). The reactant and product levels stay at 120 and 40 , so is still .
A common wrong answer for (b) is , from the peak (200) down to the product (40). That drop of 160 is the activation energy of the reverse reaction, not .
Common mistakes
- Measuring from the peak. runs from the reactant level to the product level. The peak only matters for activation energy.
- Drawing the arrow backward. The arrow starts at the reactants. Down means exothermic, up means endothermic.
- Treating the x-axis as time. Reaction progress shows the path from reactants to products, not how many seconds pass.
- Leaving off phases. and sit at different levels, so a diagram without phases is ambiguous.
- Saying a catalyst changes . It lowers only the hump. The start and end levels stay put.
- Ignoring scale. When two arrows share the same axes, the one with the bigger must be longer.