

2.4/2.5 - Other Elasticities
This covers Price Elasticity of Supply (PES), Income Elasticity, and Cross-Price Elasticity (CPE), why the Total Revenue Test doesn’t work for supply, and how to use coefficients to identify normal vs. inferior goods and substitutes vs. complements.
Price Elasticity of Supply (PES)
PES is percentage change in quantity supplied divided by percentage change in price, using the endpoint method: .
The Total Revenue Test doesn’t apply to supply, because supply curves slope upward, so total revenue always rises when price rises regardless of elasticity.
Supply coefficients are always positive:
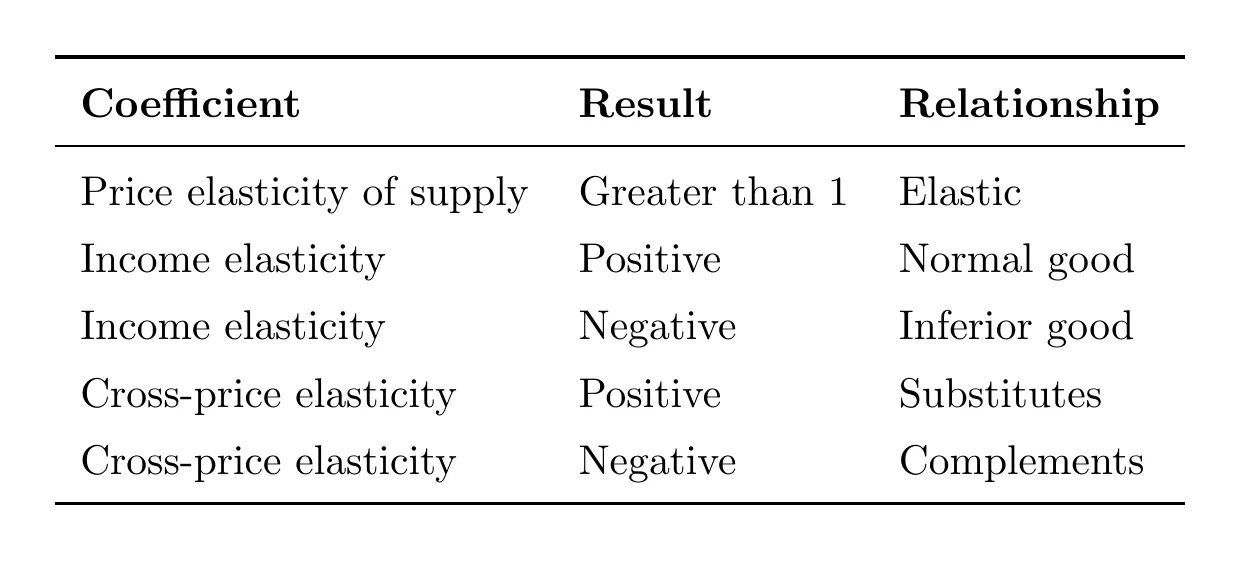
- Greater than 1: elastic, quantity supplied is very sensitive to price
- Equal to 1: unit elastic
- Less than 1: inelastic, producers barely respond to price changes
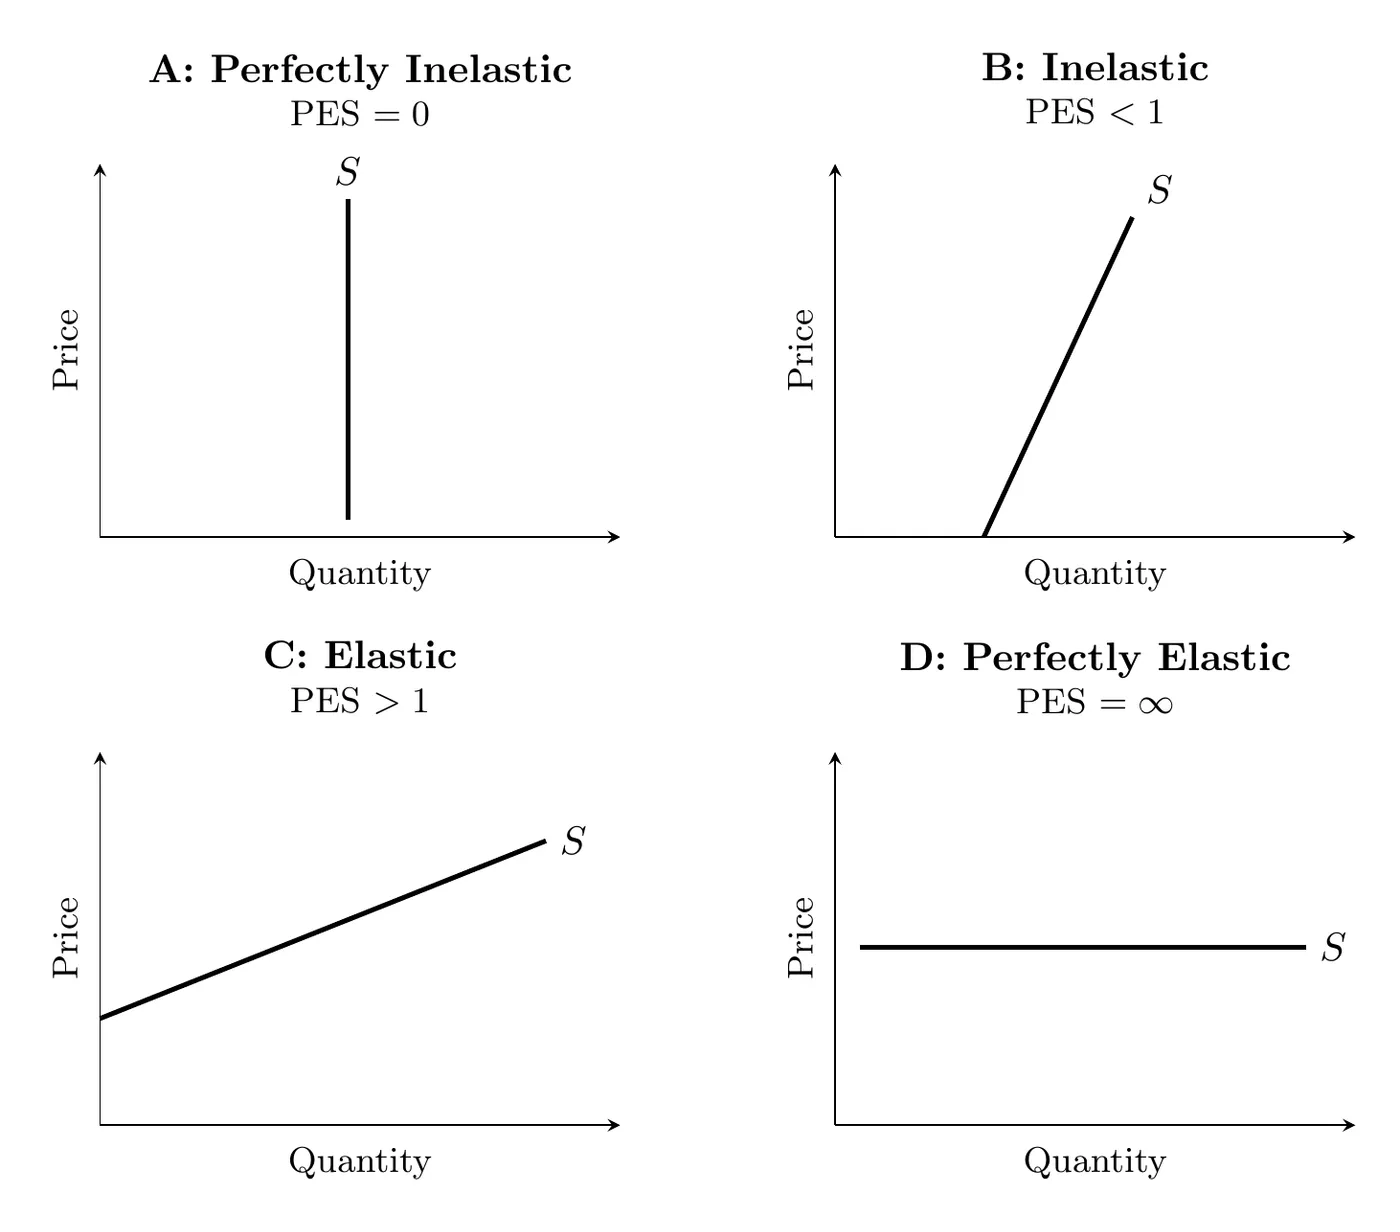
What determines PES
- Time to adjust: the biggest factor. Right after a price jump, firms are stuck with the workers, machines, and factories they already have, so supply is inelastic. Given more time, they can expand and new firms can enter, so supply gets more elastic. In the very short run supply can be perfectly inelastic, like the number of seats at a concert that’s already scheduled.
- Availability and price of inputs: if a firm can easily get more inputs, or switch to alternative inputs that don’t cost much more, it can raise output quickly when price rises, so supply is elastic. If extra inputs are scarce or expensive (rare minerals, highly trained workers), output can’t grow much, so supply is inelastic.
- Spare capacity and inventory: a factory running below full capacity, or a firm with goods in storage, can respond quickly to a higher price (elastic). A factory already running at full capacity can’t (inelastic).
Elasticity beyond price
Price isn’t the only thing quantity responds to. Elasticity can be measured for any determinant of demand or supply: divide the percentage change in quantity by the percentage change in whatever caused it. The two you need to know are income elasticity and cross-price elasticity.
Income Elasticity of Demand
This is percentage change in quantity demanded divided by percentage change in income.
- Normal goods (positive coefficient): people buy more as income rises, like high-end electronics or organic produce.
- If the coefficient is greater than 1, quantity demanded grows faster than income and the good is often called a luxury (designer clothes, cruises). Between 0 and 1, it’s a necessity (basic groceries, electricity).
- Inferior goods (negative coefficient): people buy less as income rises, like generic canned vegetables.
Cross-Price Elasticity (CPE)
This measures how a price change in Good Y affects demand for Good X: percentage change in quantity of Good X divided by percentage change in price of Good Y.
- Substitutes (positive coefficient): price of one rises, demand for the other rises too. If e-readers get pricier, demand for physical books may rise.
- Complements (negative coefficient): these are used together, so if one gets pricier, people buy less of it and demand for the other falls too. If digital camera prices drop, demand for compatible memory cards rises.
- Unrelated goods (coefficient of zero, or very close to it): a price change for one has basically no effect on demand for the other, like the price of pencils and the demand for car tires.
Worked examples
- PES: a 40% price increase for specialized glass causes a 10% increase in quantity supplied. Coefficient: (inelastic).
- Income: coefficient of , income rises 10%, so quantity demanded must have risen 20% ().
- CPE: price of Good A falls 10%, causing a 10% decrease in demand for Good B. Coefficient: . Positive, so they’re substitutes.
Takeaway
Elasticity coefficients are like DNA markers of the marketplace, revealing hidden relationships between products and consumers. Price Elasticity of Supply tells us how fast producers can pivot when prices climb, while Income and Cross-Price elasticities tell the story of a consumer’s lifestyle: whether a product is a luxury we chase as we get wealthier, a budget staple we drop once we can afford better, or a partnered good tied to the price of its companion.