

2.1 - Demand
Here we define the Law of Demand and the inverse relationship between price and quantity demanded, cover the three reasons demand curves slope downward (substitution effect, income effect, diminishing marginal utility), tell apart a change in quantity demanded from a change in demand, and go through what shifts demand.
The Law of Demand
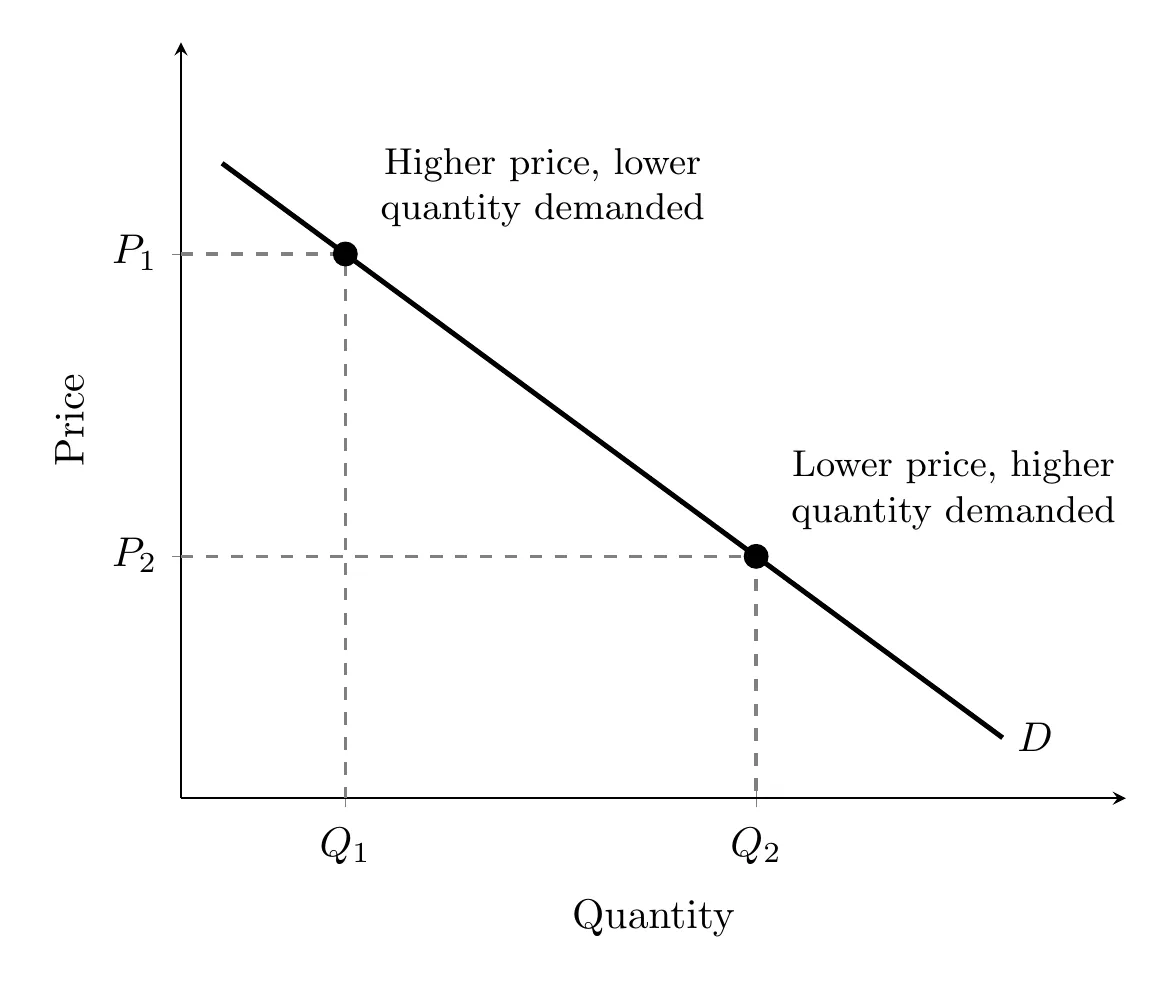
This assumes ceteris paribus, everything else held constant. There’s an inverse relationship between price and how much people are willing and able to buy: when prices are low, people buy more, and when prices are high, they buy less. Graphed, this gives you a downward-sloping demand curve.
The demand curve is also the marginal benefit (MB) curve: its height at each quantity shows the most a buyer is willing to pay for that unit, which reflects the extra benefit they expect to get from it. So when the good’s own price changes, buyers move along this curve to a new quantity demanded (in the opposite direction from the price). The curve itself doesn’t move.
Incentives and constraints
The law of demand is one example of a bigger idea: economic agents (consumers, firms, workers, the government) respond to incentives. An incentive is anything that rewards or penalizes a choice. Prices are the most common one: a higher price is a reason to buy less, and a sale is a reason to buy more.
Buyers also face constraints, limits on what they can choose:
- Income: your budget caps how much you can buy, no matter how much you want something.
- Time: a cheap concert ticket doesn’t help if you have to work that night.
- Legal and regulatory rules: laws limit what can be bought and sold, like age limits on buying alcohol or needing a prescription for some medicines.
Property rights are what let a market work in the first place. A property right is the legal right to own, use, and sell something, and to stop others from taking it. Buyers will only pay for a good if they know it will really be theirs, and sellers will only make and sell goods if they know they’ll get paid and nobody can just take what they produce. When property rights are well defined and enforced, people have an incentive to produce, invest, and trade. When they aren’t (theft goes unpunished, contracts can’t be enforced), markets stop working well.
Why demand curves slope down
- Substitution effect: if a specific sneaker brand gets more expensive, it becomes less attractive next to similar alternatives, so people switch to a cheaper brand and quantity demanded for the original drops.
- Income effect: price changes affect your purchasing power. If you have $40 for video games and the price drops from $20 to $10, your real income effectively rises since you can now afford four games instead of two.
- Diminishing marginal utility: each extra unit gives less satisfaction than the last. Since your third taco isn’t as satisfying as your first, you’ll only buy that extra one if the price drops.
Individual vs. market demand
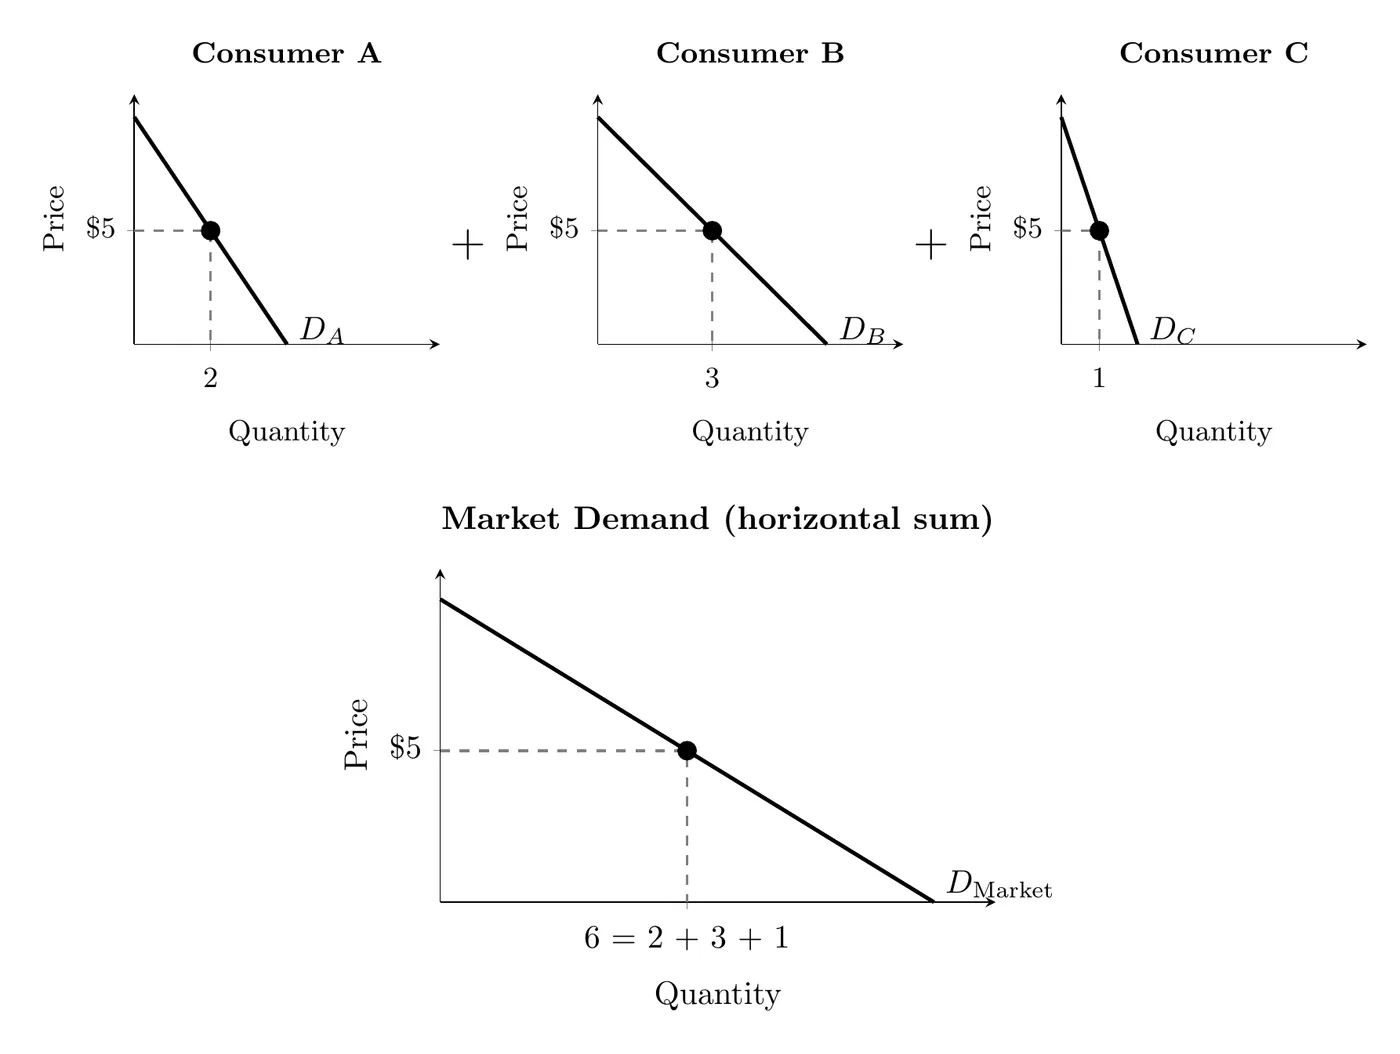
Market demand is just the sum of every individual’s demand. Add up what every consumer is willing to buy at each price, and you get the market demand curve. A demand schedule is the table listing prices and total quantities demanded; the whole table is “demand,” while any single row is “quantity demanded” at that price.
Quantity demanded vs. demand
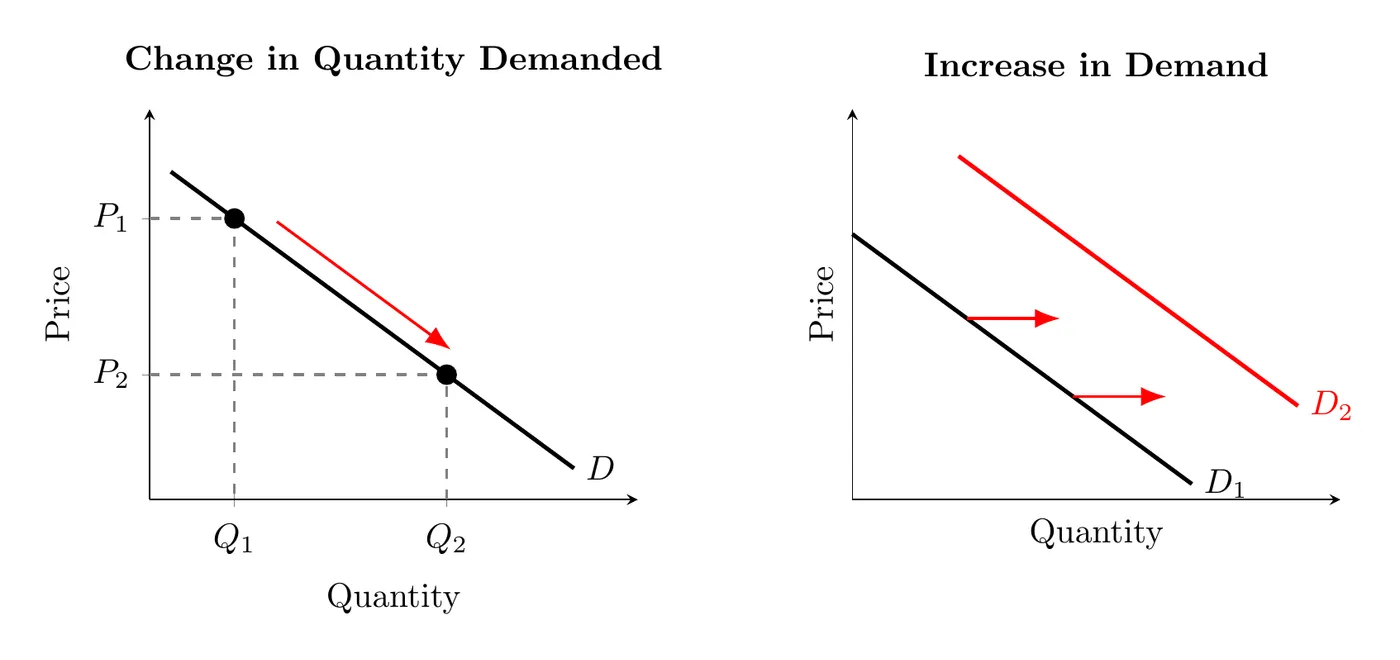
- Quantity demanded: a single point on the curve. A price change moves you along the curve.
- Demand: the whole curve. A change in demand means quantity demanded shifts at every price, moving the entire curve. Shifting right means demand increased, shifting left means it decreased.
What shifts demand
- Tastes and preferences: trending products shift demand right, out-of-style ones shift it left.
- Market size: more potential buyers shifts demand right.
- Prices of related goods:
- Substitutes: direct relationship. Pricier coffee pushes people toward tea, shifting tea demand right.
- Complements: inverse relationship. Pricier printers mean fewer printers bought, and less demand for ink, shifting ink demand left.
- Income:
- Normal goods: demand rises with income (luxury watches, new cars).
- Inferior goods: demand falls as income rises (generic detergent, used clothing).
- Future expectations: if people expect smartphone prices to jump next month, they buy more today.
Takeaway
Demand is rooted in basic human behavior: as things get pricier, our buying power shrinks and we hunt for better substitutes. A price change alone just slides us along the existing curve (quantity demanded). Real shifts happen when tastes, income, or expectations change, moving the whole foundation of what we’re willing to buy. The simple question to always ask: does this change make people want more or less of a product at every possible price?