

4.5 - Implicitly Defined Functions
Overview
Most functions so far were written explicitly, like , with alone on one side. Many important curves, like circles, come from equations where and are mixed together, like . These equations implicitly describe one or more functions. This topic covers how to graph them, how to pull functions out of them, and how and change together along the curve.
Explicit vs. implicit
- Explicit: one variable is written as a function of the other, like or .
- Implicit: an equation involving two variables where neither one is isolated, like or .
An equation involving two variables can implicitly describe one or more functions:
- describes one function, .
- describes two functions of : (the top half of a circle) and (the bottom half).
The whole graph of fails the vertical line test, so it isn't a function of . But it's made of pieces that are. Functions that come out of an equation this way are called implicitly defined functions.
Graphing by finding solutions
The graph of an equation in two variables is the set of all ordered pairs that make the equation true. So you can graph it by finding solutions:
- Pick a value for one variable (often ).
- Substitute it and solve for the other variable. There may be zero, one, or several solutions.
- Plot every solution you find, then repeat with more values.
- Connect the points smoothly, using any symmetry or extreme points you notice.
For example, in , choosing gives , so or : two points, and . Choosing gives , which has no real solution, so the graph has no points with .
Solving for one variable
Solving the equation for one of the variables defines a function whose graph is part or all of the graph of the equation.
- Solving for gives . Each sign is its own function, and each graph is half of the circle.
- Solving the same equation for gives : two functions of , the right half and the left half.
- Solving for gives , whose graph is all of the equation's graph.
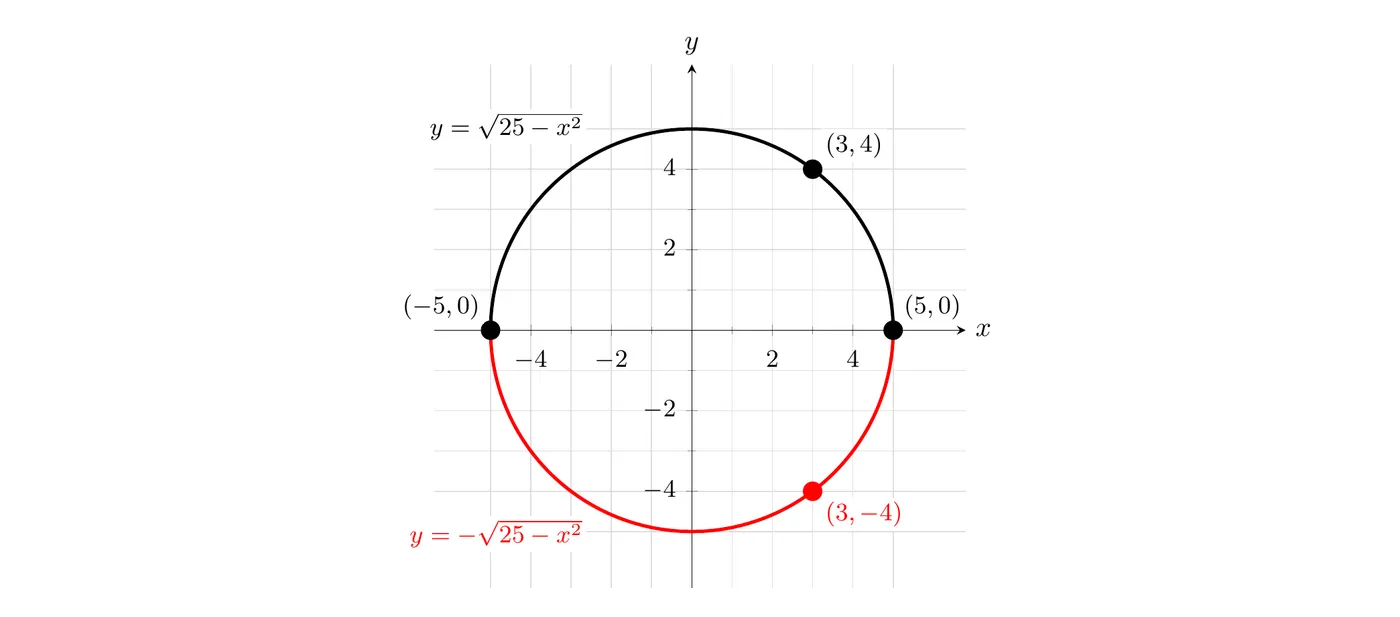
This is also how you graph an implicit equation on a calculator that only accepts functions: solve for and enter each piece, like
Y1 and Y2 . Graphing apps like Desmos can graph the original equation directly.How and change together
Along the graph of an implicitly defined function, and vary together. Take two points on the graph that are close together and compare the change in to the change in :
If the ratio is... | then... |
positive | and increase together, or decrease together |
negative | as one variable increases, the other decreases |
This is the sign of a slope, read locally, one small piece of the curve at a time. Different parts of the same curve can behave in opposite ways.
Where the graph is horizontal or vertical
The rate of change can also be zero:
- If the rate of change of with respect to is , then isn't changing while changes. The graph is horizontal there, like the top or bottom of a circle.
- If the rate of change of with respect to is , then isn't changing while changes. The graph is vertical there, like the leftmost or rightmost point of a circle.
Example 1: The circle
Use the equation . (a) Make a table of solutions and identify two functions the equation implicitly defines. (b) Near and near , describe how changes as increases. (c) Where is the graph horizontal, and where is it vertical?
(a) Solve for : . Some solutions:
Answer: The equation implicitly defines (the top half) and (the bottom half), each on .
(b) Move from to and find on each half:
Answer: Near the ratio is negative, so decreases as increases. Near the ratio is positive, so increases as increases. Same -value, opposite behavior, because the two points are on different implicitly defined functions.
(c) Near the top, , move from to : , so . That's already close to , and it gets closer as the step gets smaller. Near the right side, , swap roles and move from to : , so , again close to . The bottom and the left side work the same way.
Answer: The graph is horizontal at and , where the rate of change of with respect to is . It's vertical at and , where the rate of change of with respect to is .
Example 2: A tilted curve
Consider the equation . (a) Find all solutions with , and sketch the graph. (b) Solve for to find the functions this equation implicitly defines. (c) Where is the graph horizontal, and where is it vertical? (d) On the upper function, how does change as increases from to ?
(a) Substitute each -value and solve the quadratic in :
- : , so .
- : , so , which factors as . So or .
- : , so , which factors as . So or .
- : , so , which is . Only one solution: .
- : , so . Only one solution: .
Plot the eight points and connect them smoothly. The graph is an oval tilted along the line .
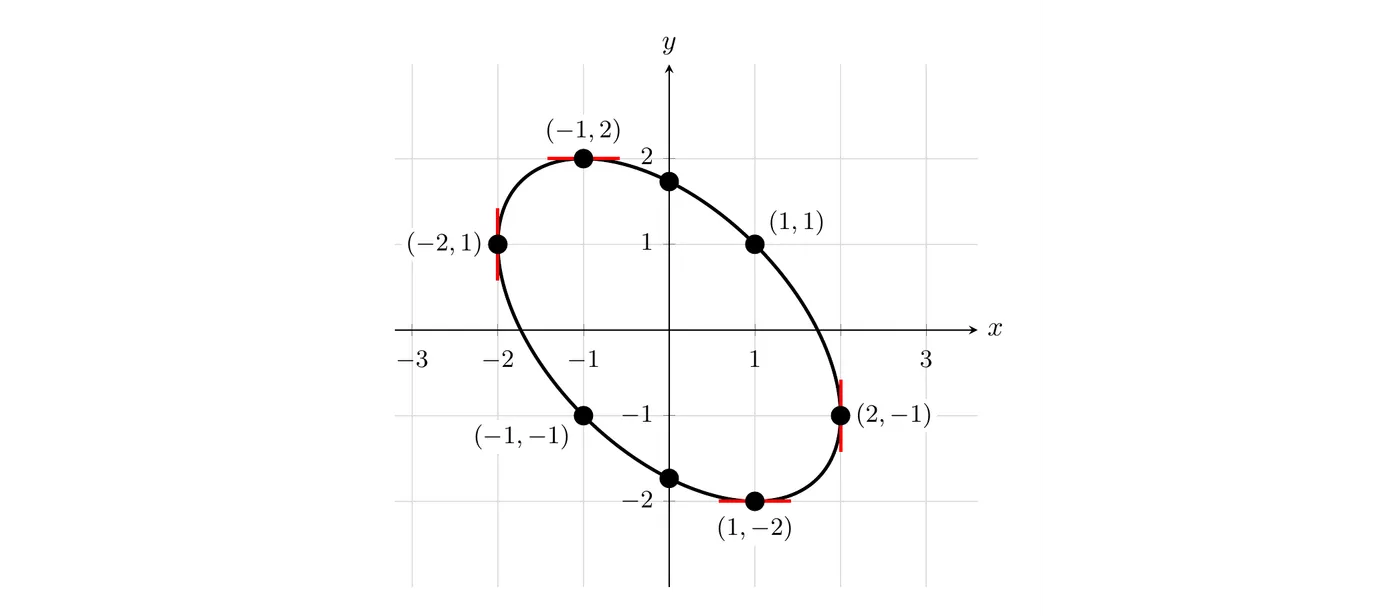
(b) Treat the equation as a quadratic in : . The quadratic formula gives
Answer: The equation implicitly defines two functions on : the upper function and the lower function . Their graphs meet at and , where the square root is .
(c) The square root needs , so . The graph has no points left of or right of , and at those two -values there's only one . So the leftmost and rightmost points, and , are where the graph turns vertical. The equation stays the same if you swap and , so the same reasoning gives , with the highest point at and the lowest at .
Answer: The graph is vertical at and , where the rate of change of with respect to is . It's horizontal at and , where the rate of change of with respect to is . The short red segments in the graph mark these four spots.
(d) Read the upper function from left to right using the points , , , , and . From to , rises from to , so . From to , falls from to , so .
Answer: On the upper function, and increase together for . For , decreases as increases. The switch happens at the highest point, , where the graph is horizontal.
Common mistakes
- Dropping the . Solving gives two functions. Writing only graphs half the curve.
- Calling the whole curve a function. The graph of the equation usually isn't a function of . The pieces you get by solving are.
- Mixing up horizontal and vertical. A rate of change of with respect to of means horizontal. A rate of change of with respect to of means vertical.
- Using points that are far apart. The sign of tells you how and vary together only for points that are close together on the same piece of the graph.
- Missing solutions. For a chosen , an implicit equation can have zero, one, or several -values. Find all of them.