

4.1 - Parametric Functions
Heads up: Unit 4 isn't assessed on the AP Precalculus Exam, but it's part of the course framework, and it sets you up for calculus and physics.
Overview
So far, every function has taken one input and given one output . A parametric function works differently: both and depend on a third variable, , called the parameter. Think of as time. As the clock runs, a point moves around the plane, and the parametric function tells you where it is at each moment. This topic covers what a parametric function is, how to build a table of values, and how to sketch its graph.
What a parametric function is
A parametric function in (the set of all ordered pairs of real numbers, which is just the coordinate plane) is a set of two parametric equations:
Both and are dependent variables. Each one depends on the same single independent variable, the parameter .
- Input: one value of .
- Output: one point in the plane.
- Graph: all the points for every in the domain. The parameter itself isn't on either axis.
Writing it as one function
The point at time is , so you can package the two equations into one function whose output is an ordered pair:
Here and are the names of two functions, not just coordinates. For example, means and . At , .
Why use a parameter?
- It tracks motion. A regular graph shows a path but not when the object was at each spot. A parametric function tells you where and when.
- It draws curves that aren't functions of . Sideways parabolas, circles, and loops fail the vertical line test, so no single can draw them. A parametric function can, because each output depends only on .
- It splits motion into parts. You can study the horizontal part and the vertical part one at a time. That idea drives the rest of this unit.
Making a table of values
To build a numerical table for , evaluate both functions at several values in the domain.
- Choose -values spread across the domain. Include the endpoints if the domain is restricted.
- Plug each into to get the -coordinate.
- Plug the same into to get the -coordinate.
- Each row gives one point , labeled with its .
Sketching the graph
Plot the points from the table and connect them in order of increasing , not in order of increasing . The order matters because the curve is the path the point actually travels.
Then add arrows along the curve to show which way the point moves as increases. This direction is called the orientation of the curve, and it's part of the graph.
Restricted domains: Start and end points
The domain of a parametric function is often restricted to an interval like . Then the graph has a start point and an end point . Draw both as filled dots, since the curve includes them, and don't extend the curve past them. With no restriction, the curve keeps going in both directions.
Example 1: Table and graph
Make a table of values and sketch the graph of for .
Step 1: Evaluate and at each integer from to .
Point | |||
Step 2: Plot the points and connect them in order from to . Add arrows for the direction of motion.
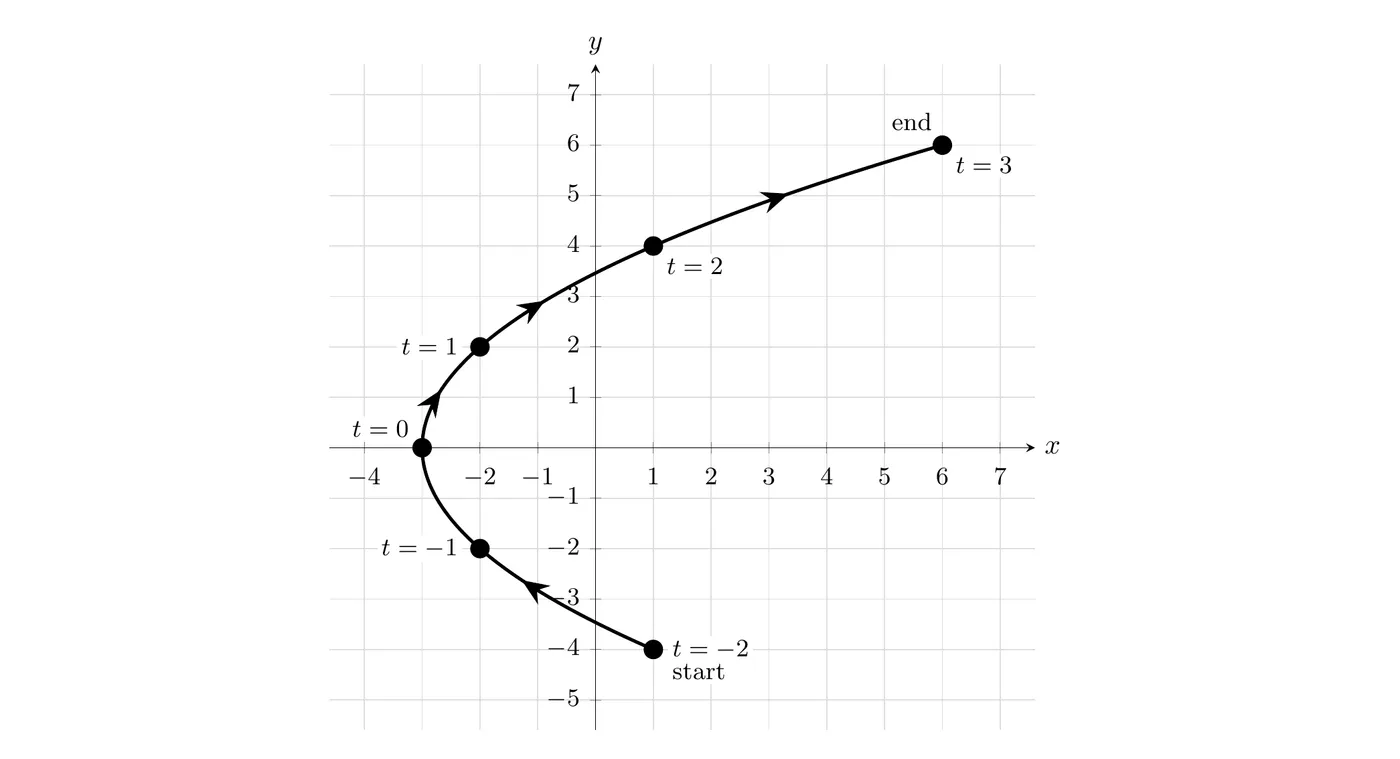
Answer: The graph is a sideways parabola that opens to the right. It starts at when , moves left to the vertex at , then moves right and up to end at when .
This graph fails the vertical line test (the line hits it twice), but it's still a perfectly good parametric function: each gives exactly one point.
Check: Since , you get . Substituting into gives , a parabola that opens right with vertex . This move is called eliminating the parameter. It confirms the shape, but it throws away the timing and the direction.
Example 2: Solving for the parameter
For the same function, with : (a) At what value(s) of is the point on the line ? (b) Is the point on the graph?
(a) Set and solve:
Both values are in the domain, and and .
Answer: The point is on the line at , where it's at , and at , where it's at .
(b) A point is on the graph only if one value of gives both coordinates. Solve each coordinate separately:
The only value that works for both is , but is outside the domain .
Answer: No. The point would be on the graph if the domain included , but with this restricted domain it isn't.
Example 3: A curve that crosses itself
Make a table of values and sketch the graph of for . Find any point the curve passes through more than once.
Step 1: Build the table. For example, at :
Point | |||
Step 2: Connect the points in order of . The curve starts at , moves up and left to the origin at , loops counterclockwise through , , and , returns to the origin at , and then heads up and to the right to end at .
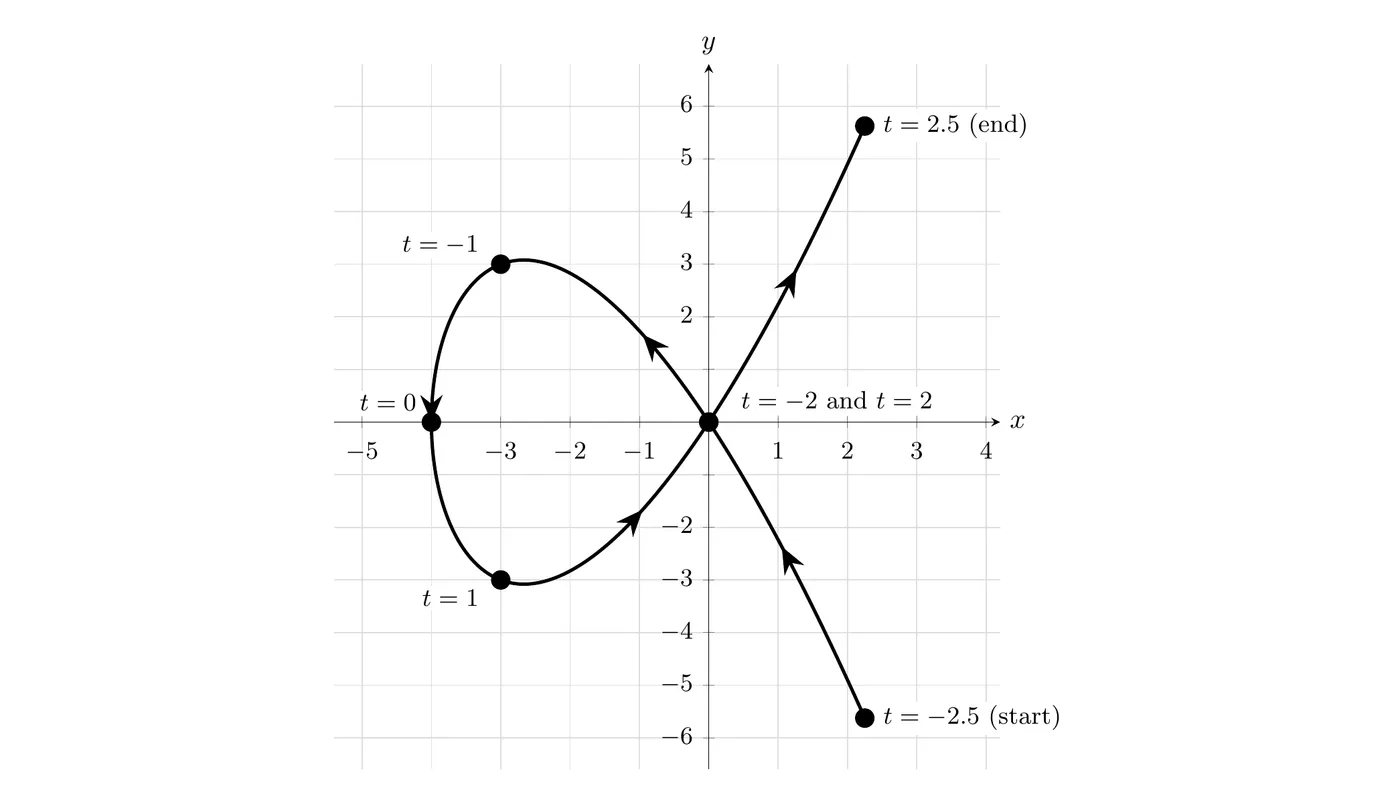
Step 3: Confirm the repeated point with algebra. when , so . Then and , so both times give .
Answer: The curve passes through the origin twice, at and at . A graph of can never do this, and it's why the table needs a column: the point alone doesn't tell you which pass you're on.
On a graphing calculator
The CED expects you to graph parametric functions with technology, including setting a good window and the right parameter limits. On a TI-84:
- Press
MODEand changeFUNCtoPAR.
- In
Y=, enter asX1Tand asY1T. TheX,T,θ,nkey types .
- In
WINDOW, setTminandTmaxto the domain, and setTstepsmall (like 0.05) so the curve looks smooth. Then setXmin,Xmax,Ymin, andYmaxso the whole path fits.
- Press
GRAPH.TRACEmoves along the curve in order of and shows , , and together, andTABLElists the values by .
Watch out: the default window uses , which can cut off or extend your curve. Always set
Tmin and Tmax yourself.Common mistakes
- Connecting points in order of . Always connect them in order of increasing . Otherwise loops and sideways curves come out wrong.
- Leaving off the arrows. The direction of motion is part of the graph. Without arrows, nobody can tell where the curve starts.
- Ignoring the domain. Draw the start and end points as filled dots and stop there. A point is on the graph only if its is in the domain.
- Putting on an axis. The axes are and . The parameter shows up only in the table or as labels on points.
- Matching coordinates from different times. For to be on the graph, the same has to give and .