

1.1 - Introducing Statistics: What Can We Learn from Data?
Overview
Statistics is the science of learning from data. This topic introduces the parts that every statistical study has: the question you want to answer, the population the question is about, the sample you actually collect data from, and the data themselves. You'll use these words on almost every free-response question in AP Statistics, so it pays to get them straight now.
What a statistical study is
A statistical study is a study in which data are collected from a sample to answer an investigative question about a larger population.
For example, suppose you want to know what proportion of students at your school have a part-time job. You probably can't ask every student, so you survey 120 of them and use their answers to say something about the whole school. That's a statistical study, and it has four parts:
- Investigative question: what you want to find out (what proportion of students at the school have a part-time job?).
- Population: the whole group the question is about (every student at the school).
- Sample: the part of the population you actually get data from (the 120 students surveyed).
- Data: the information you record (each surveyed student's yes or no answer).
Why we use samples
Collecting data from every member of the population is called a census (you'll see it again in Topic 1.10). A census sounds ideal, but it's often impossible or not worth the cost. Statistical studies are necessary when:
- The population is too large. Asking all of the roughly 260 million adults in the United States a question would take years and cost a fortune.
- It's too difficult to collect data from every individual. Some people can't be reached, and some items are spread out over time or space.
- Measuring destroys the item. To find out how long a battery lasts, you have to run it until it dies. Testing every battery would leave nothing to sell.
Because a sample is only part of the population, the answer it gives is an estimate. Later units show how to measure how close that estimate is likely to be.
Data, data sets, populations, and samples
These terms have exact meanings in statistics:
- Datum: one piece of information about one item or individual (the singular form of data). For example, "Maya has a part-time job" or "this battery lasted 11.2 hours."
- Data set: a collection of data, like all 120 survey answers.
- Population: all of the items or individuals of interest. The population size is written .
- Sample: a subset of the population that data are obtained from. The sample size, the number of items in the sample, is written .
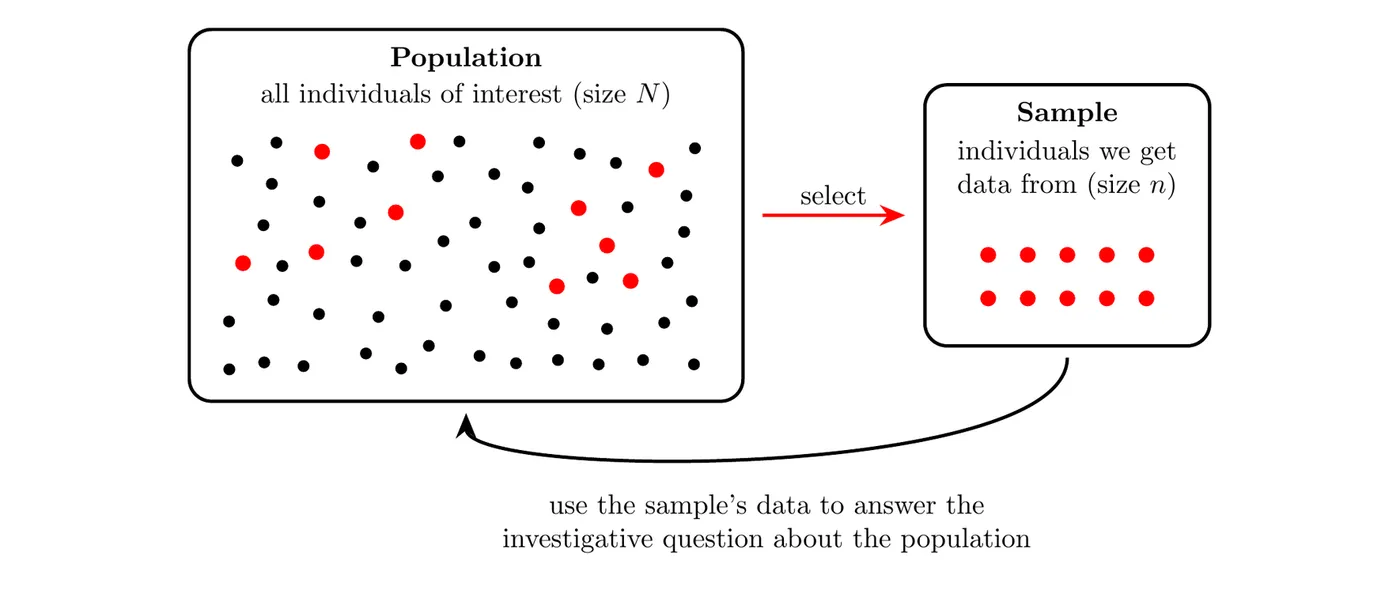
Watch the case: capital for the population, lowercase for the sample. AP questions use both without defining them.
The investigative question decides the population, not convenience. If your question is about all students at your school, the population is all students at your school, even if you only collected data from your own math class.
What "in context" means
Every part of a statistical study, and every number you calculate from it, connects to something in the real situation. Answering in context means making that connection out loud: who or what the individuals are, what was measured, and the units.
Not in context | In context |
The population is everyone. | The population is all 1,850 students at Central High School. |
The sample is the 120 students who were surveyed, so . | |
The proportion is 0.35. | 35% of the 120 surveyed students have a part-time job. |
On the AP exam, an answer that isn't in context usually loses credit even when the math is right. Get in the habit now: every answer names the individuals and the variable.
Example 1: Identifying the parts of a study
A school district with 12,400 students wants to know what proportion of its students have reliable internet access at home. The district randomly selects 350 students and asks each one, "Do you have reliable internet access at home?" Of these students, 301 say yes.
Identify the investigative question, the population and , the sample and , one datum, and the data set. Then state the result in context.
- Investigative question: What proportion of students in the district have reliable internet access at home?
- Population: all students in the district, so .
- Sample: the 350 students who were asked, so .
- One datum: one student's answer, such as the first student's "yes."
- Data set: all 350 yes or no answers.
Result: the proportion who said yes is
Answer: 86% of the 350 sampled students said they have reliable internet access at home. Notice the answer says "of the 350 sampled students," not "of the district's students." The 0.86 describes the sample, and it's an estimate of the proportion for all 12,400 students.
The investigative question
Every statistical study starts with an investigative question: the question the study is designed to answer. A good investigative question has three qualities.
It has a defined purpose and stays fixed
Decide the question before you look at any data, and don't change it based on the analysis or the results. If you search through data and then write a question to fit a pattern you happened to find, the pattern could easily be a fluke, and the conclusion can't be trusted. A new question needs a new study with new data.
It can be answered with data you can collect
The question has to be posed so that the data it needs can actually be collected and analyzed. That means it names the population, names what will be measured or recorded, and asks for data you can really get.
"Do teenagers care about the environment?" is hard to answer: "care" isn't defined, and it doesn't say which teenagers. A better version is "What proportion of students at Lincoln High School say they recycle at home at least once a week?" Now you know who to ask and exactly what to record.
It expects variability
A statistical question is one you answer with data that vary. "How tall am I?" has a single answer, so it isn't a statistical question. "What is the typical height of students at my school?" is one, because heights differ from student to student. If every individual were the same, you'd only need to measure one.
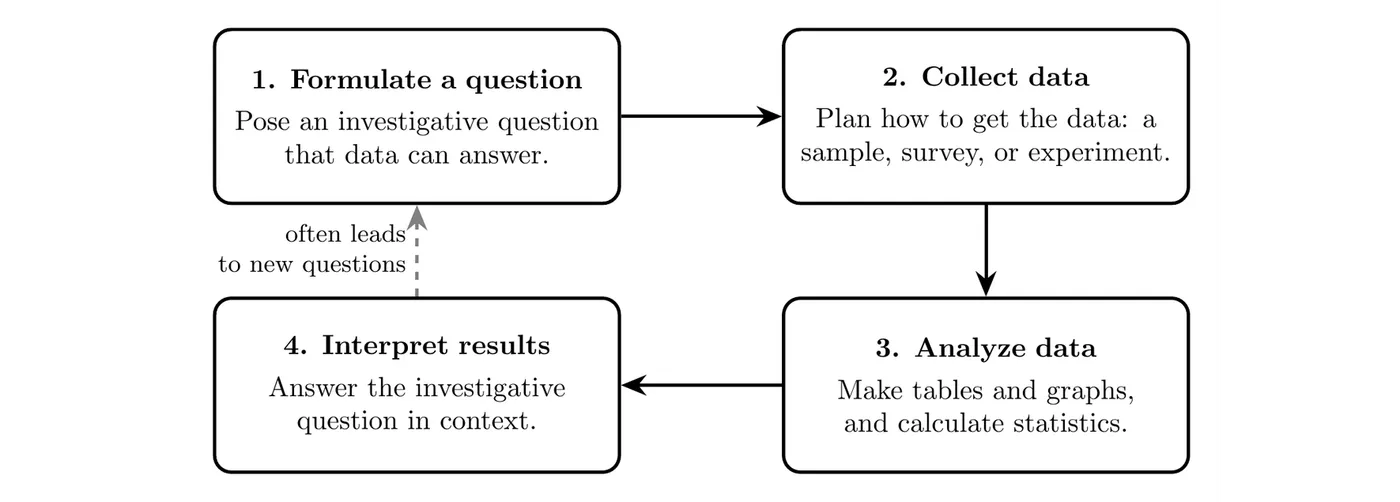
The investigative question comes first because it guides every later step: what data to collect, how to analyze them, and what kind of conclusion you can draw. Topic 1.10 breaks a full investigative question into these parts.
Example 2: Judging investigative questions
Decide whether each one is a good investigative question for a statistical study. Explain.
- "How many hours did I sleep last night?"
- Not statistical. It's about one person on one night, so there's one number and no variability.
- "Do students sleep enough?"
- Too vague. "Enough" isn't defined, and the population isn't named, so you can't tell what data to collect.
- "What is the mean number of hours of sleep on a school night for students at Lincoln High School?"
- Good. It names the population (students at Lincoln High School) and the variable (hours of sleep on a school night), and the data can be collected with a survey. Sleep varies from student to student.
- After looking at a season of game data, a coach notices that players with jersey numbers under 20 scored more, so he asks, "Do players with jersey numbers under 20 score more points?"
- Not valid. The question was written after seeing the data, to match a pattern found in them. To study it fairly, he'd need to start with the question and collect new data.
Example 3: A battery study (AP-style)
A company makes 80,000 phone batteries each day. To check quality, an inspector randomly selects 40 batteries from one day's production, charges each one fully, and runs it until it dies, recording how many hours it lasted. The average (mean) life of the 40 batteries is 11.6 hours.
(a) Identify the population and the sample, with their sizes.
(b) Explain why the company uses a sample instead of testing every battery.
(c) State an investigative question this study can answer.
(d) Interpret 11.6 hours in context.
Solution
(a) The population is all 80,000 batteries made that day, so . The sample is the 40 batteries that were tested, so .
(b) Testing a battery means running it until it dies, so a tested battery can't be sold. Testing all 80,000 would use up the whole day's production. A sample of 40 gives an estimate and leaves the rest to sell.
(c) "What is the mean battery life, in hours, of the batteries made on this day?"
(d) The 40 batteries tested lasted 11.6 hours on average. This is an estimate of the mean battery life of all 80,000 batteries made that day, not its exact value.
Common mistakes
- Mixing up the population and the sample. The population is everyone or everything the question is about. The sample is only the part you got data from.
- Answering without context. "The proportion is 0.86" earns less than "86% of the 350 surveyed students said they have reliable internet at home."
- Treating a sample result as the population's exact value. A sample gives an estimate.
- Writing a question with no variability or no clear data. "How old is the principal?" has one answer, and "Are people happy?" doesn't say who to ask or what to measure.