

1.2 - Variables
Overview
Once you know the question and the population, you need to know exactly who you're collecting data from and what you're recording about them. This topic covers observational units and variables, the two main types of variables (categorical and quantitative), the two types of quantitative variables (discrete and continuous), and the difference between a parameter and a statistic. The type of variable decides which graphs and summaries you can use for the rest of the course.
Observational units and variables
An observational unit is the item or individual that a datum is collected from. Observational units are often people, but they can be anything: animals, batteries, cities, songs, basketball games, or days.
A variable is a characteristic that may change from one observational unit to another, like a student's height, a battery's life in hours, or a city's population.
Data are usually stored in a table where each row is one observational unit and each column is one variable. Here's a small data set from a survey of students:
Student | How they get to school | Commute time (minutes) | Number of siblings | Home zip code |
Ava | Car | 12 | 1 | 60614 |
Ben | Bus | 25 | 0 | 60622 |
Carla | Walk | 8 | 3 | 60614 |
Dev | Bike | 15 | 2 | 60647 |
Emma | Car | 20 | 1 | 60622 |
The observational units are the 5 students, one per row. The four columns after the name are the variables. The name column just identifies each unit.
Data don't have to start as numbers
Data on categorical and numerical variables can come from photographs, sounds, videos, and text, and they can carry real information. The trick is to decide what the observational unit is and what you'll record about each one.
- Photographs: wildlife researchers use trail cameras. Each photo is an observational unit, and they record the species shown and the number of animals.
- Sounds: each recording of a bird call is a unit, with the species and the length of the call in seconds.
- Videos: each game film is a unit, with the number of completed passes and which team won.
- Text: each online product review is a unit, with whether the review is positive or negative and how many words it has.
Categorical and quantitative variables
Every variable is one of two types.
- A categorical variable, also called a qualitative variable, takes values that are category names or group labels. Examples: how a student gets to school, eye color, a yes or no answer.
- A quantitative variable, also called a numerical variable, takes numerical values for a measured or counted quantity, and it generally has units of measure. Examples: commute time in minutes, number of siblings.
A quick test: does it make sense to average the values? An average commute time of 16 minutes means something, so commute time is quantitative. An average zip code means nothing, so zip code is categorical.
Numbers that are really labels
Some categorical variables are written with numbers: zip codes, phone numbers, jersey numbers, student ID numbers. The digits are names for groups, not amounts, so these variables are categorical.
Also, the same characteristic can be recorded either way. Age in years is quantitative. Age group (under 18, 18 to 64, 65 and over) is categorical. How the data are recorded decides the type.
Discrete and continuous quantitative variables
Quantitative variables split into two types.
- A discrete variable can take on a countable number of values. The number of values can be finite (the number of correct answers on a 20-question quiz is one of 0, 1, 2, ..., 20) or countably infinite, like the whole numbers 0, 1, 2, 3, ... with no fixed top (the number of texts you get in a day). Discrete variables are usually counts.
- A continuous variable can take on infinitely many values within an interval. Its values are measured, not counted, and it can take every value between any two of its values. Continuous variables are usually measurements: height, weight, time, distance, temperature.
Here's a way to see the difference. Between a commute of 15 minutes and one of 16 minutes there are endless possible times: 15.5, 15.25, 15.125, and so on. Between 2 siblings and 3 siblings there's nothing.
Rounding doesn't change the type. Commute time recorded to the nearest minute is still continuous. The real time could be any value; the rounding just comes from how precisely we measured it.
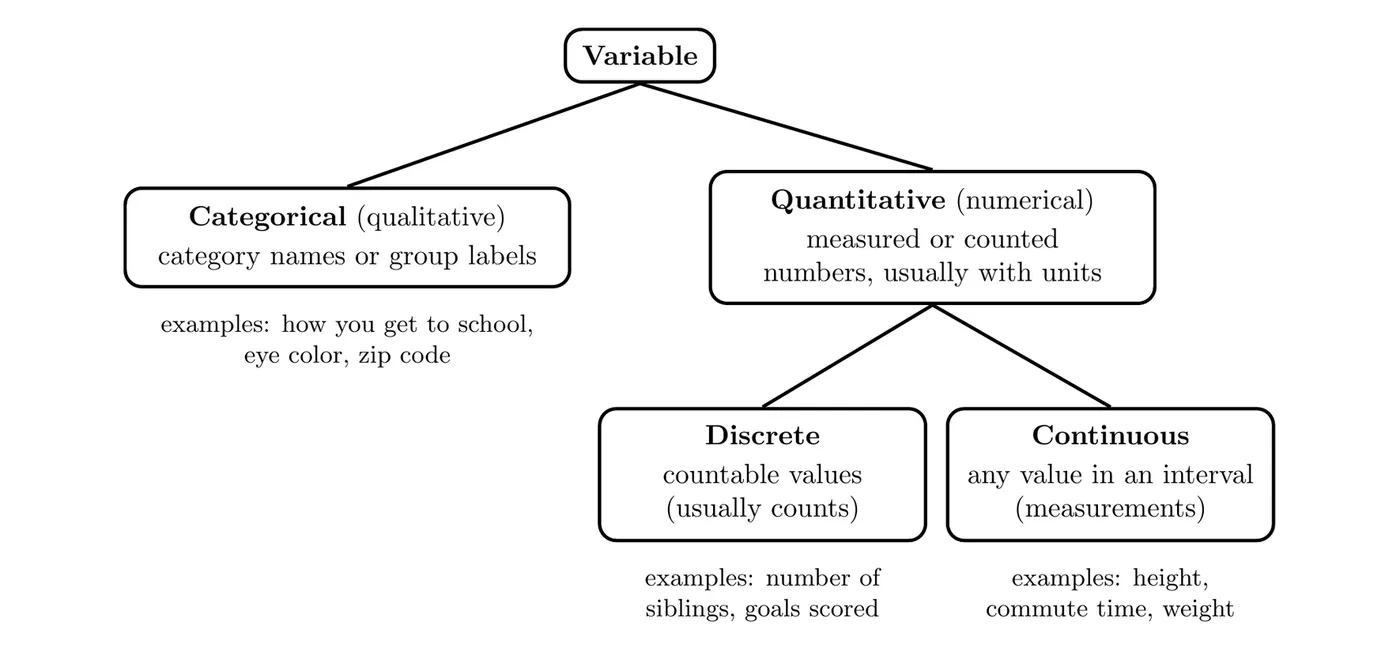
Example 1: Classifying the variables
For the student data table above, identify the observational units and classify each variable.
- Observational units: the 5 students.
- How they get to school: categorical. The values (Car, Bus, Walk, Bike) are group labels.
- Commute time (minutes): quantitative and continuous. It's a measured time, any value in an interval is possible, and its units are minutes.
- Number of siblings: quantitative and discrete. It's a count, so only whole numbers are possible.
- Home zip code: categorical. The numbers are labels for places, and an average zip code means nothing.
Parameters and statistics
Numbers that summarize a variable come in two kinds, depending on where they come from.
- A parameter is a numerical summary of the variable for the whole population. Because we rarely have data on the whole population, a parameter is usually unknown.
- A statistic is a numerical summary of the variable for a sample. You calculate it from the data you have.
Memory trick: Parameter goes with Population, and Statistic goes with Sample.
A statistic usually isn't exactly equal to the parameter, since a sample is only part of the population, and a different sample would give a different value. But the statistic is our best information about the parameter, so it's the basis for making inferences about it. That's the main job of Units 3 and 4.
Parameters get Greek letters, and statistics get Roman letters. You'll learn to calculate means and standard deviations in Topic 1.7, but learn the symbols now:
Summary | Parameter (population) | Statistic (sample) |
Mean | ("mu") | ("x-bar") |
Standard deviation | ("sigma") | |
Proportion | ("p-hat") |
Example 2: Parameter or statistic?
Is each number a parameter or a statistic? Give its symbol.
- Company records show that the mean age of all 1,240 employees is 38.2 years.
- Parameter, years. It describes every employee, the whole population.
- In a poll of 800 likely voters in a state, 52% support a ballot measure.
- Statistic, . It comes from a sample of 800 voters, not every voter in the state.
- Of 50 bags of chips taken from a production line, the mean weight is 28.1 grams.
- Statistic, grams. It comes from a sample of 50 bags.
- A teacher wants to know how her own 28 students did on a unit test. Their mean score is 81.5.
- Parameter, . Her 28 students are the entire population she cares about. If she used her class to estimate the mean for all students taking the test statewide, the same 81.5 would be a statistic.
The last one shows why you always ask, "What's the population?" The same number can be a parameter or a statistic depending on the question.
Example 3: Trail cameras (AP-style)
Last summer, 60 trail cameras in a national park took 18,000 photos. Researchers randomly select 400 of the photos. For each photo they record the species shown (deer, coyote, bear, other, or no animal), the number of animals in the photo, and the air temperature in degrees Fahrenheit stamped on the photo. In the sample, 92 of the 400 photos show a deer.
(a) What are the observational units?
(b) Identify each variable as categorical or quantitative. For each quantitative variable, say whether it is discrete or continuous.
(c) Is the proportion of photos showing a deer a parameter or a statistic? Calculate it and interpret it in context.
(d) Would you expect the proportion of all 18,000 photos showing a deer to equal your answer to (c)? Explain.
Solution
(a) The individual trail camera photos. Each photo is one observational unit.
(b) Species shown is categorical. Number of animals is quantitative and discrete (a count). Air temperature is quantitative and continuous (a measurement).
(c) It's a statistic, because it comes from the sample of 400 photos:
So 23% of the 400 sampled photos show a deer. The matching parameter is , the proportion of all 18,000 photos that show a deer, which is unknown.
(d) Probably not exactly. A different random sample of 400 photos would likely give a somewhat different proportion. The value 0.23 is an estimate of , not its exact value.
Common mistakes
- Calling number labels quantitative. Zip codes, jersey numbers, and ID numbers are categorical.
- Calling rounded measurements discrete. Time, height, and weight are continuous even when rounded.
- Swapping parameter and statistic. Ask whether the number describes the whole population or just a sample.
- Using the wrong symbol. , , and come from samples. , , and describe populations.
- Naming the variable vaguely. Write "commute time in minutes," not "commute."
- Mixing up the unit and the variable. The observational unit is who or what you collect data from. The variable is what you record about it.