

1.11 - Random Sampling
Overview
A sample is only as good as the method used to choose it. This topic covers sampling with and without replacement, the four random sampling methods on the AP exam (simple random, stratified, cluster, and systematic), and how to justify which method fits a study. On free-response questions you'll often have to describe a method clearly enough that someone else could carry it out.
Sampling without and with replacement
- Without replacement: once a unit is selected, it isn't returned to the population before the next selection, so it can't be selected again. Drawing names from a hat and keeping the drawn slips out is sampling without replacement.
- With replacement: each selected unit is returned to the population before the next selection, so the same unit could be selected again. Drawing a name, writing it down, and putting the slip back is sampling with replacement.
Say a hat holds 5 slips and the first slip drawn is A. With replacement, the chance that the second slip is also A is still . Without replacement, it's 0.
Almost every real survey samples without replacement, because asking the same person twice adds no new information. Sampling with replacement shows up mostly in simulations and probability (Unit 2), where each draw should have the same chances as the one before.
Simple random sample (SRS)
In a simple random sample (SRS) of size , every possible sample of that size has the same chance of being selected. The SRS is the basis for many other sampling methods. Stratified and cluster sampling, for example, both use an SRS as one of their steps.
How to select an SRS
There are several ways to get an SRS, such as a random number generator or numbered slips of paper drawn from a well-mixed hat. A complete description on the AP exam has three steps:
- Label: give each unit in the population a different number from 1 to .
- Randomize: use a random number generator to pick different numbers from 1 to , ignoring repeats. (Or put numbered slips in a hat, mix well, and draw without replacement.)
- Select: the units with the chosen numbers make up the sample.
On a TI-84,
randInt(1, N) (press MATH and arrow over to PRB, or PROB on newer models) gives one random whole number from 1 to . Press ENTER for each new number and skip any repeats. Newer TI-84 Plus CE calculators also have randIntNoRep(, which never repeats.Example 1: Describing an SRS
The principal of a school with 1,200 students wants an SRS of 50 students to survey about a new bell schedule. Describe how to select the sample.
Get a list of all 1,200 students and number them from 1 to 1,200. Use a random number generator to produce 50 different whole numbers from 1 to 1,200, ignoring any repeats. Survey the 50 students whose numbers come up.
This works because it says how students are labeled, how the random numbers are made, what happens with repeats, and who is sampled. "Pick 50 students at random" would not earn credit.
Example 2: Equal chances for people isn't enough
A population has 6 people, numbered 1 to 6, and you want a sample of 2. Compare an SRS with this method: choose 1, 2, or 3 at random, then also take the person whose number is 3 higher.
SRS: list every possible sample of 2 people:
{1, 2}, {1, 3}, {1, 4}, {1, 5}, {1, 6}, {2, 3}, {2, 4}, {2, 5}, {2, 6}, {3, 4}, {3, 5}, {3, 6}, {4, 5}, {4, 6}, {5, 6}
There are 15 samples, and in an SRS each has probability . Each person is in 5 of them, so each person's chance of being chosen is
The other method: only three samples are possible, {1, 4}, {2, 5}, and {3, 6}, each with probability . Each person is in exactly one of them, so each person's chance of being chosen is still . But a sample like {1, 2} can never happen.
Answer: both methods give every person a chance, but only the SRS gives every sample the same chance. The second method is random (it's a systematic random sample, covered below), but it isn't an SRS.
Stratified random sample
To take a stratified random sample, divide everyone in the population into non-overlapping groups called strata (one group is a stratum), based on one or more shared characteristics. Then select an SRS within each stratum and combine them into one sample.
Strata are homogeneous groups: the units in a stratum are similar to each other, ideally in ways related to the variable you're measuring. Grade level, region, and age group are common choices. Stratifying helps in two ways:
- It guarantees that every stratum is represented in the sample.
- When the response differs a lot from one stratum to another, it gives a more precise estimate (less variability from sample to sample) than an SRS of the same size.
Many studies use proportional allocation, where each stratum's share of the sample matches its share of the population.
Example 3: Proportional allocation
A high school has 400 freshmen, 350 sophomores, 300 juniors, and 250 seniors. The school wants a stratified random sample of 52 students, stratified by grade, with each grade represented in proportion to its size. How many students should come from each grade, and how should they be chosen?
Step 1: Find the population size and the fraction of it being sampled.
Step 2: Multiply each grade's size by 0.04.
Check: .
Step 3: Within each grade, number the students and use a random number generator to choose an SRS of the right size (for example, 16 different numbers from 1 to 400 for the freshmen). Combine the four SRSs.
Answer: select an SRS of 16 freshmen, 14 sophomores, 12 juniors, and 10 seniors, for 52 students in all.
Cluster random sample
To take a cluster random sample, divide the population into smaller groups called clusters. Select an SRS of clusters, then collect data from every unit in each selected cluster.
Ideally, each cluster is heterogeneous, a mix that mirrors the whole population, so the clusters are similar to one another. Then a few clusters give a fair picture of everything.
The main reason to use clusters is convenience. Surveying every student in 5 randomly chosen homerooms is much easier than tracking down 150 students scattered across a school.
Stratified and cluster samples both split the population into groups, so they're easy to mix up:
Stratified random sample | Cluster random sample | |
The groups are | Homogeneous (similar units within each stratum) | Heterogeneous (each cluster mirrors the population) |
Random step | An SRS within every stratum | An SRS of clusters |
Who is sampled | Some units from every stratum | All units in a few clusters |
Main purpose | Representation and precision | Convenience and lower cost |
Systematic random sample
A systematic random sample selects units using a random starting point and a fixed, periodic interval between selections. From a list of units, for a sample of about , use the interval (rounded down to a whole number if needed). Pick a random start from 1 to , then take every th unit after it.
Systematic sampling is quick and spreads the sample evenly through the list. It works well when the order of the list has nothing to do with the variable being measured, like an alphabetical list or customers in the order they arrive. Watch out for lists with a repeating pattern: in a daily log where every 7th entry is a Sunday, using could give you only Sundays.
Example 4: Selecting a systematic sample
The school from Example 1 has an alphabetical list of its 1,200 students. Describe how to select a systematic random sample of 50 students.
Step 1: Find the interval.
Step 2: Use a random number generator to pick a starting number from 1 to 24. Suppose it's 17.
Step 3: Select student 17 and every 24th student after that:
Answer: this gives 50 students (the starting student plus 49 more) spread evenly through the alphabetical list. Only 24 different samples are possible, one for each starting number, so this sample is random but it isn't an SRS.
The four methods side by side
The figure shows one sample from each method, taken from the same population of 96 units. Selected units are red.
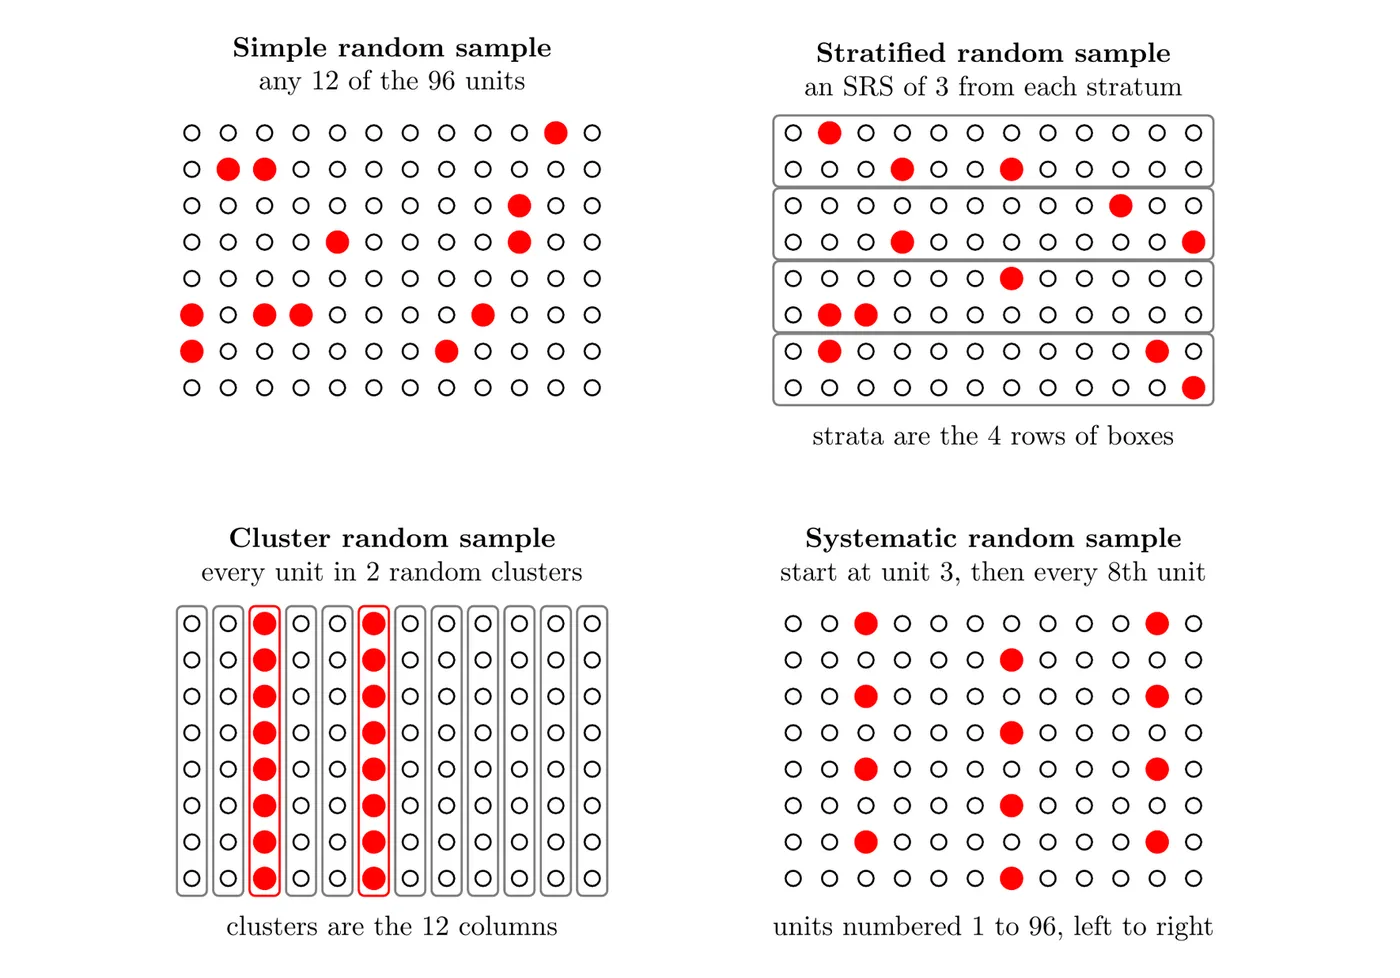
- Simple random sample: any 12 of the 96 units. An SRS can be lumpy. By chance, two of the eight rows have no one selected, while another row has four.
- Stratified random sample: exactly 3 units from each of the 4 strata (the boxed pairs of rows), 12 in all.
- Cluster random sample: every unit in 2 randomly chosen clusters (columns), 16 in all. Each column runs through every row, so each cluster is a mix of the population.
- Systematic random sample: with the units numbered 1 to 96 from left to right, row by row, start at unit 3 and take every 8th unit, 12 in all.
Choosing a sampling method
Each random sampling method has different characteristics that make it more appropriate for some populations and questions than others.
Method | Good choice when | Watch out for |
Simple random | You have a list of the whole population and no useful way to group it | Can miss small groups by chance; costly if units are spread out |
Stratified | The response likely differs between groups you can identify ahead of time | You need to know each unit's stratum before sampling |
Cluster | Units come in natural groups that each mirror the population, and reaching a whole group is cheap | If clusters differ from each other, estimates vary a lot from sample to sample |
Systematic | Units are in a list or a line with no pattern related to the response | A repeating pattern in the list can line up with the interval |
A justification for stratifying on the AP exam always has the same core: the stratifying variable is related to the response, so units within a stratum are similar, and sampling from every stratum gives a more precise estimate than an SRS of the same size.
Example 5: Choosing and justifying a method (AP-style)
A state agency wants to estimate the proportion of the state's 8,000 farms that use drip irrigation. Of these, 3,000 farms are in the dry western region and 5,000 are in the wetter eastern region. Drip irrigation is much more common in the west.
(a) Explain why stratifying by region is a good idea.
Drip irrigation use is related to region: western farms are much more likely to use it than eastern farms. Taking an SRS from each region makes sure the sample can't end up with too many or too few western farms by chance. That gives a more precise estimate of the statewide proportion than an SRS of the same size.
(b) Describe how to select a stratified random sample of 200 farms using proportional allocation.
Number the western farms from 1 to 3,000 and use a random number generator to choose 75 different numbers. Number the eastern farms from 1 to 5,000 and choose 125 different numbers the same way. The 200 selected farms form the sample.
(c) A worker suggests choosing 5 of the state's counties at random and surveying every farm in those counties. Name this method and give one advantage and one disadvantage.
This is a cluster random sample, with counties as the clusters. Advantage: it's cheaper and faster, since surveyors travel to only 5 counties. Disadvantage: each county lies in one region, so counties don't mirror the state. By chance, all 5 counties could be in the east, which would make the estimate much too low, so this design's estimates vary more from sample to sample than the stratified design's.
Common mistakes
- Writing "choose them randomly." Describe the labels, the random mechanism, how repeats are handled, and who ends up in the sample.
- Thinking any random method gives an SRS. In an SRS every possible sample of size is equally likely. Stratified, cluster, and systematic samples are random, but they aren't SRSs.
- Swapping strata and clusters. Strata are similar inside, and you sample from every one. Clusters are mixed inside, and you take everyone in a few of them.
- Stratifying on a variable unrelated to the response. It doesn't improve the estimate. The point of strata is that the response differs between them.