

1.10 - The Investigative Question Revisited and Data Collection
Overview
Topic 1.1 introduced the investigative question, the question a statistical study is built to answer. This topic looks closer at its three parts, then covers the main ways to collect data: a census, an experiment, or an observational study. How the data are collected decides what you're allowed to conclude, and that's one of the most tested ideas on the AP exam.
The three parts of an investigative question
A good investigative question does three jobs. It tells you what data to collect, which analysis to run, and what kind of conclusion the study can support.
Part 1: The variable (guides data collection)
The first part should guide the data collection process, so it's phrased in terms of the variable or variables of interest. Then you know exactly what to record for each observational unit.
"Do teens sleep enough?" fails this test: which teens, and what counts as enough? "How many hours do students at Westfield High School sleep on a typical school night?" names a variable you can actually measure.
Part 2: The parameter and the goal (guides the analysis)
The second part should guide the choice of analysis. It makes the parameter clear, such as a population proportion or a population mean , and says what you want to learn about it.
- Hypothesis test: the question makes clear the parameter and the direction of the alternative hypothesis, which is the claim you're looking for evidence of. You'll learn how tests work in Units 3 and 4. For now, learn to read the direction from the wording.
- Confidence interval: the question makes clear the parameter and that the goal is to estimate it with a range of plausible values. Words like "estimate" or "what is the mean" signal an interval.
Wording in the question | Direction of the alternative |
"Is it different from...?" or "Has it changed?" | Not equal () |
"Is it greater than...?" or "Has it increased?" | Greater than () |
"Is it less than...?" or "Has it decreased?" | Less than () |
"Is there an association between...?" or "Does one variable depend on the other?" | There is an association, or the variables are not independent (two categorical variables) |
Part 3: The type of conclusion
The third part indicates what kind of conclusion the study can support. It names the population the conclusions apply to. If the study is an experiment that uses random assignment, it can also ask a cause-and-effect question, like whether a treatment causes a change in the response.
Example 1: Breaking down investigative questions
Identify the three parts of each question.
Question A: "Is the proportion of all juniors at Westfield High School who have a part-time job greater than 0.25?"
- Part 1: the variable is whether a junior has a part-time job (categorical: yes or no), so you'd record yes or no for each junior in the sample.
- Part 2: the parameter is , the proportion of all Westfield juniors who have a part-time job. "Greater than 0.25" signals a hypothesis test with the alternative .
- Part 3: conclusions apply to all juniors at Westfield. Nobody is assigned to have a job, so this isn't a cause-and-effect question.
Question B: "What is the mean number of hours per week that all juniors at Westfield High School spend on homework?"
- Part 1: the variable is hours of homework per week (quantitative).
- Part 2: the parameter is , the mean hours per week for all Westfield juniors. The goal is to estimate with a range of plausible values, so this calls for a confidence interval.
- Part 3: conclusions apply to all juniors at Westfield.
Question C: "For volunteers like those in this study, does taking a caffeine pill cause faster reaction times than taking a placebo pill?"
- Part 1: the variables are the treatment (caffeine or placebo) and reaction time in milliseconds.
- Part 2: the parameter is the difference in true mean reaction times, (C for caffeine, P for placebo). Faster means less time, so "faster" signals a hypothesis test with the alternative .
- Part 3: this is an experiment with random assignment, so it can support a cause-and-effect conclusion, but only for people similar to the volunteers.
Census
A census records information from every item or individual in the population. With a census you know the parameter exactly, so there's nothing to estimate.
Topic 1.1 covered why censuses are rare: the population is too big, the individuals are too hard to reach, or measuring destroys the item. A census makes sense when the population is small and easy to reach, like the 28 students in one class.
Experiments
In an experiment, a researcher assigns conditions, called treatments, to experimental units to explore an investigative question about the population. The key word is assigns: the researcher decides who gets what.
- Experimental unit: the observational unit that a treatment is assigned to. Units can be people, plants, cars, or batches of cookies. When the units are people, they're often called subjects or participants.
- Explanatory variable (factor): a variable whose categories, or levels, are imposed on the experimental units.
- Treatments: the levels of the explanatory variable. When there's more than one explanatory variable, each treatment is a combination of levels, one from each factor.
- Response variable: the outcome measured on each experimental unit after the treatment has been given.
Example 2: Factors, levels, and treatments
A gardener tests two fertilizers (A and B) and three watering amounts (low, medium, and high) on 60 tomato plants. After 10 weeks she measures each plant's tomato yield in kilograms. Identify the experimental units, factors, treatments, and response variable.
- Experimental units: the 60 tomato plants.
- Factors: fertilizer type (2 levels: A and B) and watering amount (3 levels: low, medium, and high).
- Treatments: every combination of one fertilizer and one watering amount, so there are treatments: A low, A medium, A high, B low, B medium, and B high.
- Response variable: each plant's tomato yield, in kilograms.
Answer: 60 plants, 2 factors, 6 treatments, and the response is yield in kilograms. Treatments are combinations, so multiply the numbers of levels; adding them () is a common mistake.
Observational studies
In an observational study, treatments are not imposed. The researcher records the values of the variables of interest to explore the investigative question. Observational studies are often the only ethical option: no one can assign teenagers to smoke for 10 years to see what happens to their lungs.
Three kinds come up often:
- Prospective study: the observational units are selected at one point in time, and data are gathered at that time and into the future. Example: select 2,000 adults today, record their exercise habits, and follow their heart health for 20 years.
- Retrospective study: the observational units are selected at one point in time, and data from the past are gathered. Example: select 500 adults who have heart disease and 500 who don't, then look back through their records for past exercise habits.
- Survey: an observational study in which data are collected from people using a standard set of questions.
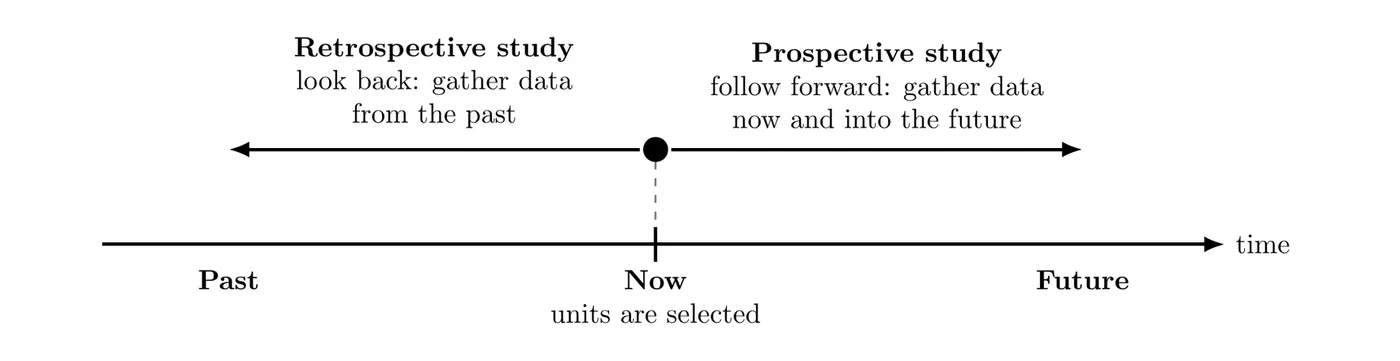
Prospective and retrospective describe which way in time the data come from, starting when the units are selected. A survey describes how the data are collected (a set of questions), so a survey can ask about the present or the past.
Confounding variables in observational studies
An observational study can show an association between an explanatory variable and a response variable, but it can't show that one causes the other. The reason is confounding.
A confounding variable in an observational study gives another explanation for the relationship observed between the explanatory and response variables, which makes it harder to conclude that the relationship is causal. To be a confounding variable, a variable must be associated with both the explanatory variable and the response variable.
Example: an observational study finds that students who eat breakfast every day have higher GPAs than students who don't. Does breakfast raise grades? Maybe, but hours of sleep could be a confounding variable.
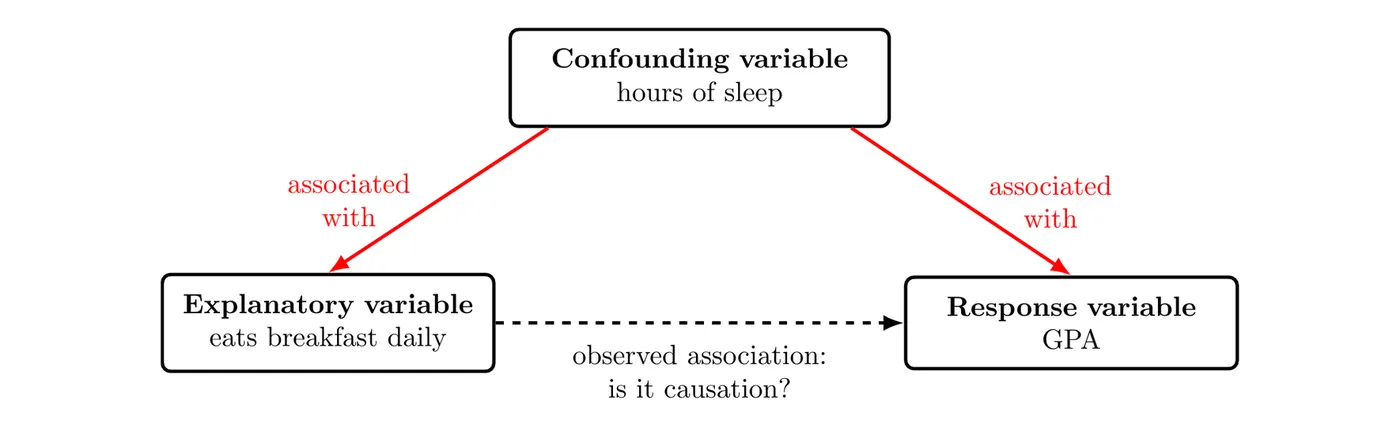
- Students who sleep more are more likely to have time for breakfast, so sleep is associated with the explanatory variable.
- Students who sleep more tend to focus better in class and earn higher grades, so sleep is associated with the response variable.
The higher GPAs might come from the extra sleep, not the breakfast, and this study can't tell the two apart. On the AP exam, explaining confounding means describing both links in context. Just naming a variable isn't enough.
Generalizing results to a population
Whether you can apply a study's results to a larger population depends on how the units got into the study.
- A sample is random when all of its observational units are selected from the population by a random mechanism, such as a random number generator. When the units are randomly selected, it's appropriate to generalize to the entire population they were selected from.
- A sample is not random when its units are deliberately chosen or volunteer themselves. Then it's appropriate to generalize only to a population of individuals similar to those in the study.
Put this together with Part 3 of the investigative question and every study answers two separate questions, often called the scope of inference:
Treatments randomly assigned | Treatments not randomly assigned | |
Units randomly selected | Generalize to the population; cause and effect can be concluded | Generalize to the population; association only |
Units not randomly selected | Generalize only to units like those in the study; cause and effect can be concluded | Generalize only to units like those in the study; association only |
Random selection decides who you can generalize to. Random assignment decides whether you can conclude cause and effect. Use each term in the right place. Writing "random selection" when the question is about an experiment's treatments (or the other way around) costs points on the AP exam.
Example 3: What kind of study is it?
Classify each study as a census, an experiment, or an observational study. For an observational study, say whether it's prospective, retrospective, or a survey.
- A principal records the GPA of every student at her school to find the school's mean GPA.
- Census. Data come from every student in the population, so the mean GPA she computes is the parameter itself.
- A researcher randomly assigns 80 volunteers to drink either regular coffee or decaf, then times how long each takes to solve a puzzle.
- Experiment. The researcher assigns the treatments (regular coffee or decaf).
- Doctors select 300 patients with lung cancer and 300 without, then check their records for how many years each person smoked.
- Observational study, retrospective. Nothing is imposed, and the smoking data come from the past.
- A research team selects 1,000 babies born in 2026 and records their screen time and reading scores every year until age 12.
- Observational study, prospective. The units are selected now and followed into the future. Screen time is recorded, not assigned.
Example 4: Study type, confounding, and scope (AP-style)
A researcher selects a random sample of 800 students from a large school district. Each student fills out a questionnaire reporting their average daily social media use and how often they have trouble falling asleep. Students who use social media more than 3 hours a day were more likely to report trouble falling asleep.
(a) Is this an experiment or an observational study? Explain.
It's an observational study (a survey). The researcher didn't assign anyone an amount of social media use. The students reported their own habits.
(b) Can the researcher conclude that heavy social media use causes trouble falling asleep? Identify a possible confounding variable and explain.
No. In an observational study, a confounding variable could explain the association. One possibility is stress. Students under a lot of stress may spend more time on social media to distract themselves, so stress is associated with the explanatory variable. Stress also makes it harder to fall asleep, so it's associated with the response variable. Stress, not social media, could be the reason heavy users report more trouble sleeping.
(c) To what population can the results be generalized? Explain.
To all students in this school district, because the 800 students were randomly selected from the district. The results shouldn't be generalized to all teenagers in the country, since students outside the district had no chance of being selected.
Common mistakes
- Calling a study an experiment because it compares groups. Comparing people who chose to exercise with people who didn't is still observational. It's an experiment only if the researcher assigns the treatments.
- Adding factor levels instead of multiplying. Two factors with 2 and 3 levels give treatments, not 5.
- Explaining confounding with only one link. Show how the variable is associated with both the explanatory variable and the response, in context.
- Mixing up random selection and random assignment. Selection lets you generalize to a population. Assignment lets you conclude cause and effect.
- Generalizing from volunteers to everyone. Results from volunteers or a hand-picked sample apply only to individuals similar to those in the study.