

4.3 - Justifying a Claim Based on a Confidence Interval for a Population Mean or Population Mean Difference
Overview
A confidence interval is only useful if you can say what it means and use it to answer a question. This topic covers how to interpret a confidence interval for or and its confidence level, how to use an interval as evidence about a claim, and how the sample size and confidence level change the interval's width.
Any one interval might miss
A confidence interval comes from one random sample. A different sample would give a different , a different , and a different interval. So the interval you computed may or may not contain the true population mean (or mean difference). You never get to find out for sure.
Interpreting the confidence level
The confidence level describes the method, not one particular interval:
In repeated random sampling with the same sample size from the same population, about C% of the confidence intervals created will capture the population mean (or population mean difference).
The figure shows 25 simulated 95% -intervals. Each comes from a different random sample of 12 cold brews from a population where we pretend to know that mg. The intervals bounce around, and their widths differ too, because each sample has its own . In this run, 23 of the 25 intervals (92%) captured . Over many thousands of samples, the capture rate settles at 95%.
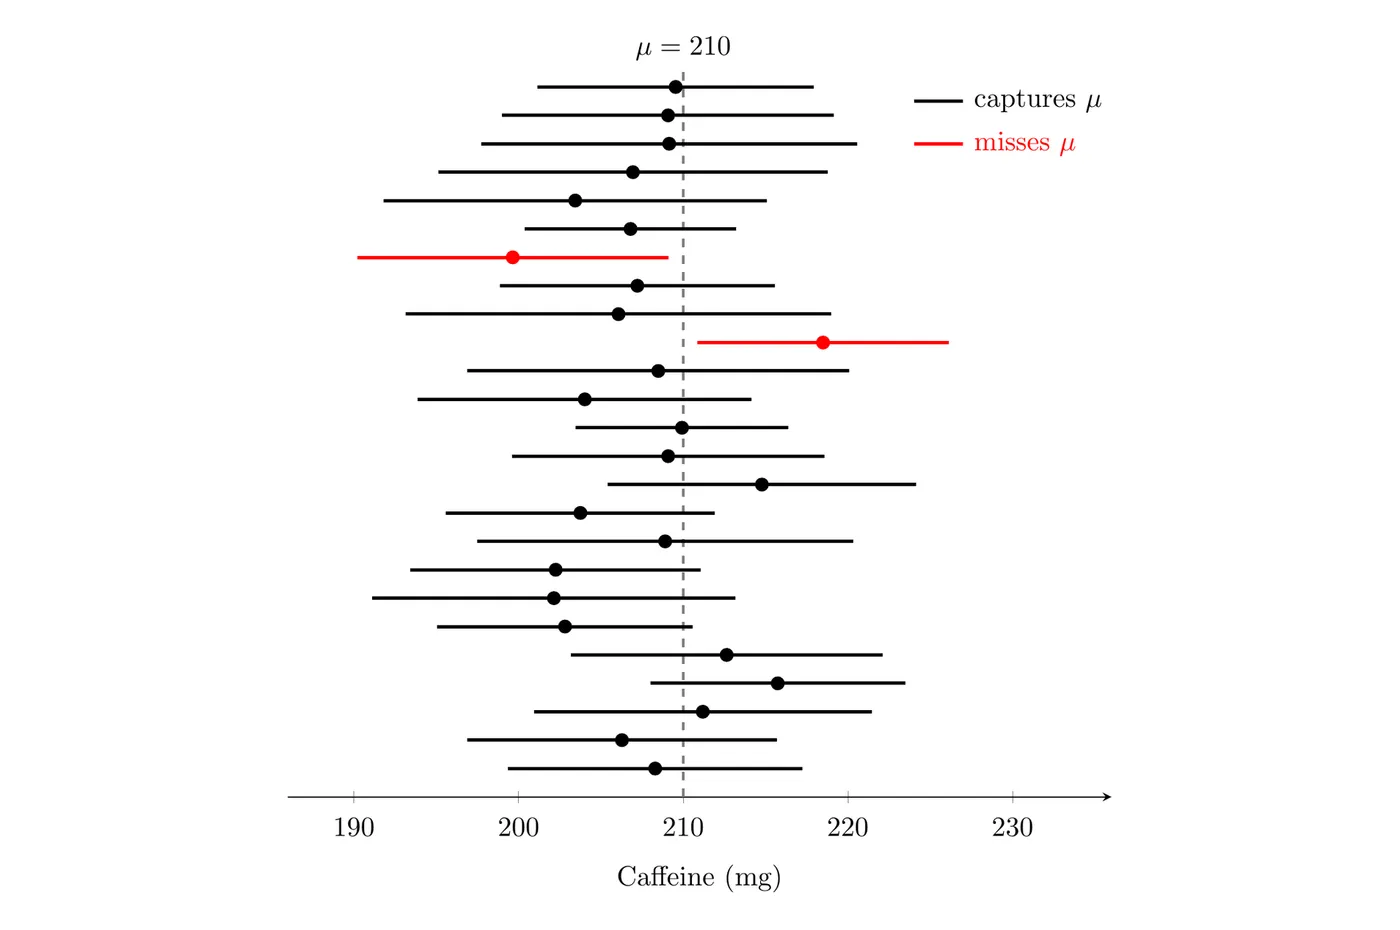
Don't say "there's a 95% probability that is in this interval." Once an interval is computed, is either in it or not. The 95% describes how often the method works in the long run.
Interpreting the interval
To interpret a specific C% interval from to , use this form:
We are C% confident that the interval from a to b captures the true [population mean or mean difference, in context].
A full interpretation has the confidence level, the endpoints, and a reference to the parameter in context: "the true mean caffeine content of all large cold brews sold by this chain," not a statistic like "the mean of our 12 drinks." For , include the order of subtraction.
Using an interval to justify a claim
The values inside a confidence interval are the plausible values of the parameter. That makes the interval a tool for judging claims:
- Claimed value outside the interval: the claim isn't plausible. The interval gives convincing evidence against it.
- Claimed value inside the interval: the claim is plausible. The interval does not give convincing evidence against it. That's not proof the claim is true, since every other value in the interval is plausible too.
- Matched pairs: look for 0 in the interval for . If the whole interval is above 0 (or below 0), there's convincing evidence of a real mean difference, and the sign tells you the direction. If 0 is inside, "no difference" is plausible.
This matches significance tests (Topic 4.5): a two-sided test at significance level rejects exactly when falls outside the confidence interval from the same data.
Example 1: Checking an advertised mean
In Topic 4.2, a consumer group's random sample of 12 large cold brews gave a 95% confidence interval of (202.8, 221.2) mg for the mean caffeine content. The chain advertises 200 mg. (a) Interpret the interval. (b) Interpret the confidence level. (c) Does the interval give convincing evidence that the advertised mean is wrong? (d) Is a true mean of 215 mg plausible?
(a) We are 95% confident that the interval from 202.8 mg to 221.2 mg captures the true mean caffeine content of all large cold brews sold by this chain.
(b) If we took many random samples of 12 large cold brews from this chain and built a 95% -interval from each one, about 95% of those intervals would capture the true mean caffeine content.
(c) Yes. The advertised value of 200 mg is below the entire interval, so it isn't a plausible value for the true mean. The interval gives convincing evidence that the true mean caffeine content isn't 200 mg, and it suggests the true mean is higher.
(d) Yes. 215 mg is inside the interval, so it's a plausible value for the true mean. That doesn't show the mean is 215 mg.
Example 2: Did reading scores go up?
In Topic 4.2, a 95% confidence interval for , the true mean difference in reading score (after minus before) for students in a summer program, was (3.32, 8.68) words per minute. Does the interval give convincing evidence that the mean reading score increased during the program?
Answer: Yes. Every value in the interval is positive, so 0 isn't a plausible value for . Since the differences are after minus before, this is convincing evidence that the true mean reading score went up for students in the program, by somewhere between about 3.3 and 8.7 words per minute.
Be careful with cause and effect. This was a random sample with no comparison group, not a randomized experiment. Scores went up, but we can't conclude the program caused it; students might have improved over the summer anyway.
What changes the width
The width of the interval is twice the margin of error, . Two choices you control affect it.
Confidence level
For a given sample, increasing the confidence level:
- increases the critical value
- increases the margin of error, and
- increases the width of the interval.
To be more confident you'll capture , you need a wider net. You trade precision for confidence.
Sample size
Increasing the sample size decreases the standard error . So when everything else stays the same, the interval tends to get narrower as grows. The width is roughly proportional to , which means you need about four times as many observations to cut the width in half. (For -intervals, df also grows with , which shrinks a little, so the width drops a bit faster than that.)
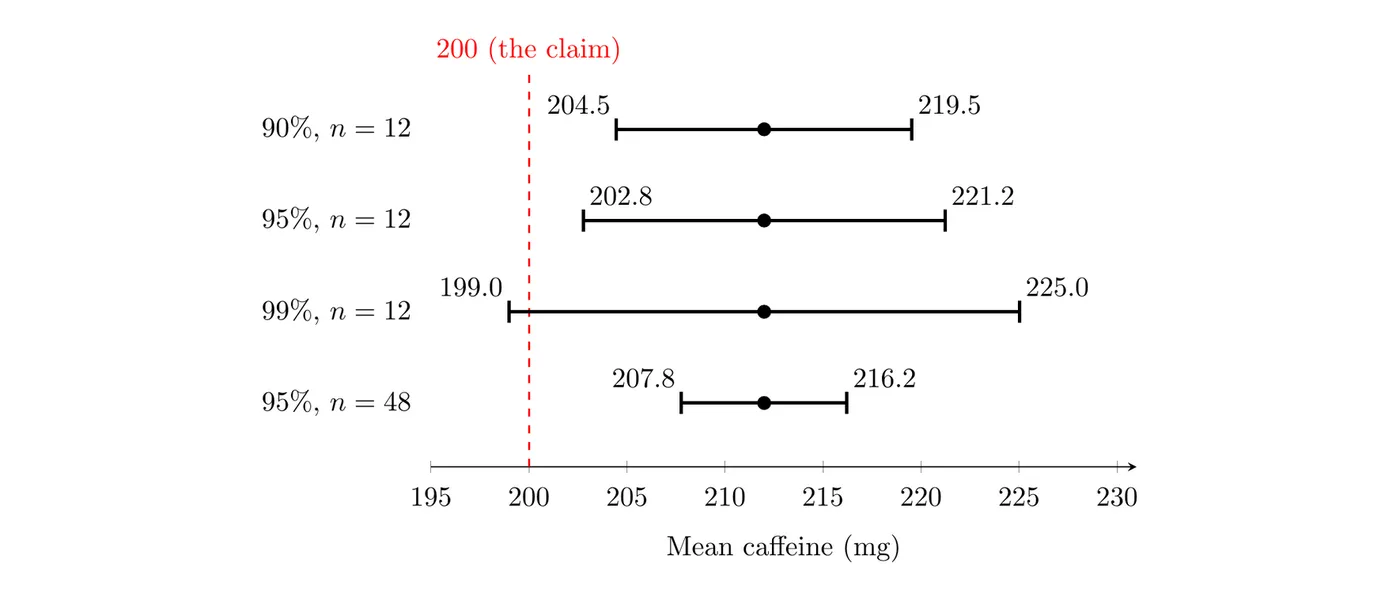
The figure shows intervals for the cold brew sample at three confidence levels, plus what a sample of 48 drinks with the same and would give. The red line marks the chain's claim of 200 mg.
Change (everything else the same) | Standard error | Margin of error and width | |
Higher confidence level | Increases | No change | Increase |
Lower confidence level | Decreases | No change | Decrease |
Larger sample size | Decreases slightly (more df) | Decreases | Decrease |
Smaller sample size | Increases slightly (fewer df) | Increases | Increase |
Example 3: Trade-offs (AP-style)
Use the cold brew sample: mg, mg, . (a) Construct a 99% confidence interval. Does it still give convincing evidence against the chain's claim of 200 mg? (b) Suppose a second study bought 48 drinks and got the same and . How would the 95% interval change?
(a) For 99% confidence with df = 11, :
Now 200 mg is inside the interval. At the 99% confidence level, 200 mg is a plausible value, so this interval does not give convincing evidence against the claim. Raising the confidence level widened the interval enough to include it. A conclusion can depend on how confident you need to be.
(b) With , df = 47, so , and the standard error drops to :
The margin of error falls from 9.23 mg to 4.22 mg, a little less than half of what it was. Four times the sample size cut the standard error in half, and also dropped from 2.201 to 2.012.
Common mistakes
- Interpreting the interval as a range for individual values ("95% of cold brews have between 202.8 and 221.2 mg"). It's about the population mean.
- Saying there's a 95% chance that is in this particular interval.
- Claiming a value inside the interval is proven to be the true mean. Inside means plausible, not proven.
- Leaving out the context, or the order of subtraction for .
- Thinking a higher confidence level makes the interval more precise. It makes it wider.
- Drawing a cause-and-effect conclusion from data that didn't come from a randomized experiment.