

4.7 - Constructing a Confidence Interval for the Difference Between Two Population Means
Overview
A two-sample -interval estimates the difference between two population means, , using independent random samples from two populations or the two groups in a randomized experiment. It answers questions like "How much more sleep do juniors get than seniors, on average?" This topic covers choosing the procedure, stating the parameter, checking the conditions, and calculating the interval. Topic 4.8 covers interpreting the interval and using it to judge claims.
Choosing the procedure
Based on sample data, you can build a confidence interval to estimate the difference between two population means. For two independent samples, the right procedure is a two-sample -interval for the difference between population means. Use it when:
- the response variable is quantitative, so you're comparing means, not proportions;
- there are two independent samples, or two treatment groups formed by random assignment; and
- the question asks you to estimate the size of the difference ("how much," "estimate," "construct an interval").
Exam questions often test whether you can tell it apart from the procedures next to it:
Situation | Procedure |
One group, quantitative variable | One-sample -interval for (Topic 4.2) |
Paired data: the same subjects measured twice, or matched pairs | One-sample -interval for , on the differences (Topic 4.2) |
Two independent groups, quantitative variable | Two-sample -interval for |
Two independent groups, categorical variable | Two-sample -interval for (Topic 3.10) |
To decide between paired and two-sample, ask: does each value in one group have a natural partner in the other group (the same person, a twin, a matched plot of land)? If yes, the data are paired. If the groups are separate people or objects, use the two-sample procedure.
Stating the parameter
The parameter must name the difference in the population means, the response variable, and both populations, in context, with a clear order of subtraction. For example:
, where is the true mean number of hours of sleep on a school night for all juniors at the school and is the true mean for all seniors at the school.
Just writing "the difference in mean sleep" leaves out which groups, which means, and which order. For an experiment, the "populations" are the treatments, for example "the true mean number of words recalled by people like these volunteers if they all studied in silence."
Checking the conditions
A two-sample -interval for a difference between population means requires three conditions:
- Randomization condition: the data should be collected using two independent random samples or a randomized experiment.
- 10% condition: when sampling without replacement, each sample size must be at most 10% of its population size: and . This condition isn't needed for a randomized experiment, since no population is being sampled.
- Sample data condition: both samples have , or the problem says both population distributions are approximately normal. If either sample is smaller than 30, check graphs of both samples for strong skewness and outliers.
Each condition has a job: randomization makes the groups representative (or comparable, in an experiment), the 10% condition keeps the values close enough to independent for the standard error formula, and the sample data condition makes the sampling distribution of close enough to normal for the procedure.
For small samples, a dotplot, boxplot, or stemplot of each sample is enough. Say what you see: "the dotplots of both groups show no strong skewness and no outliers." Just writing "normal" is too vague, and it's a common way to lose the point.
Calculating the interval
Like every confidence interval, this one is point estimate ± margin of error. The point estimate for is the difference in sample means, . The standard error estimates how much that difference varies from sample to sample, using the sample standard deviations and :
The margin of error is the critical value times the standard error, , so the interval is:
Here is the critical value that captures the central C% of a -distribution with the appropriate degrees of freedom. This matches the formula sheet's general form: statistic ± (critical value)(standard error of the statistic).
Degrees of freedom
For two samples there's no simple df formula. The exact df comes from a long formula that your calculator applies for you, and it's usually a decimal. It always falls between the smaller of and and .
- With technology (preferred): use the df the calculator reports. This gives the most accurate interval.
- Without technology: use df equal to the smaller of and , and look up in Table B. If that df isn't a row in the table, use the next smaller row. This is the conservative choice: a smaller df gives a larger , so the interval comes out a little wider than it needs to be.
AP scoring accepts either df, as long as your work shows what you used.
On the TI-84
Press STAT, arrow to TESTS, and choose 0:2-SampTInt. Choose Stats to type in , , , , , (or Data if the values are in lists), set the C-Level, and set Pooled: No. The output gives the interval and the df. Pooling assumes the two population standard deviations are equal, which you can rarely justify, so leave it on No.
Example 1: Sleep for juniors and seniors
A teacher at a large high school takes a random sample of 45 of the school's 620 juniors and a separate random sample of 38 of its 590 seniors, and asks each student how many hours they usually sleep on a school night. Juniors: hours, hours. Seniors: hours, hours. Construct and interpret a 95% confidence interval for the difference in mean hours of sleep.
State: We want to estimate with 95% confidence, where is the true mean hours of sleep on a school night for all juniors at the school and is the true mean for all seniors at the school.
Plan: Two-sample -interval for . Conditions:
- Randomization: two independent random samples, one of juniors and one of seniors.
- 10%: and .
- Sample data: and .
Do: Find the standard error:
The calculator gives df and , so the interval is:
Without technology, df . That row isn't in Table B, so use the df row: . Then , or , slightly wider.
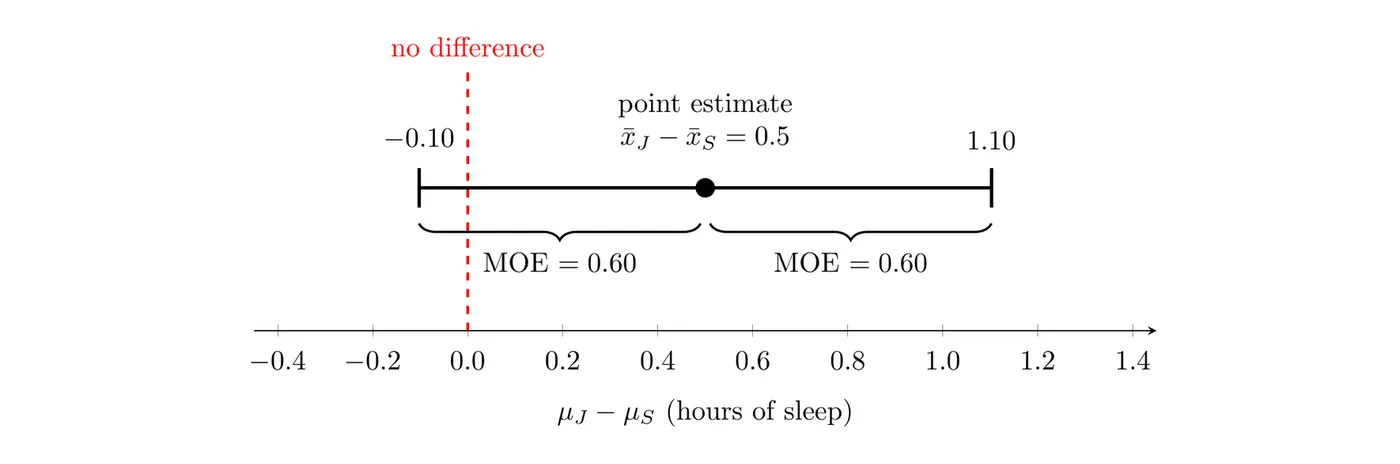
Conclude: We are 95% confident that the interval from to hours captures the true difference in mean hours of sleep on a school night (juniors minus seniors) for all juniors and seniors at this school. The interval includes 0, so these data don't give convincing evidence of a difference in mean sleep between juniors and seniors. Topic 4.8 explains this reasoning.
Example 2: Studying with music (AP-style)
A psychology student recruits 24 volunteers. She randomly assigns 12 of them to study a list of 30 words in silence and the other 12 to study the same list while music plays. After 10 minutes, each person writes down as many words as they remember. The numbers of words recalled:
Group | Words recalled |
Silence | 18, 16, 21, 17, 19, 15, 20, 22, 17, 18, 19, 16 |
Music | 14, 17, 12, 19, 15, 16, 13, 18, 15, 11, 16, 14 |
Construct a 95% confidence interval for the difference in mean number of words recalled (silence minus music).
State: We want to estimate with 95% confidence, where is the true mean number of words recalled for people like these volunteers who study in silence and is the true mean for people like these volunteers who study with music.
Plan: Two-sample -interval for . Conditions:
- Randomization: the two treatments were randomly assigned to the volunteers. This is a randomized experiment, so the 10% condition isn't needed.
- Sample data: each group has only 12 values, fewer than 30, so check graphs of both samples. The dotplots show no strong skewness and no outliers in either group.
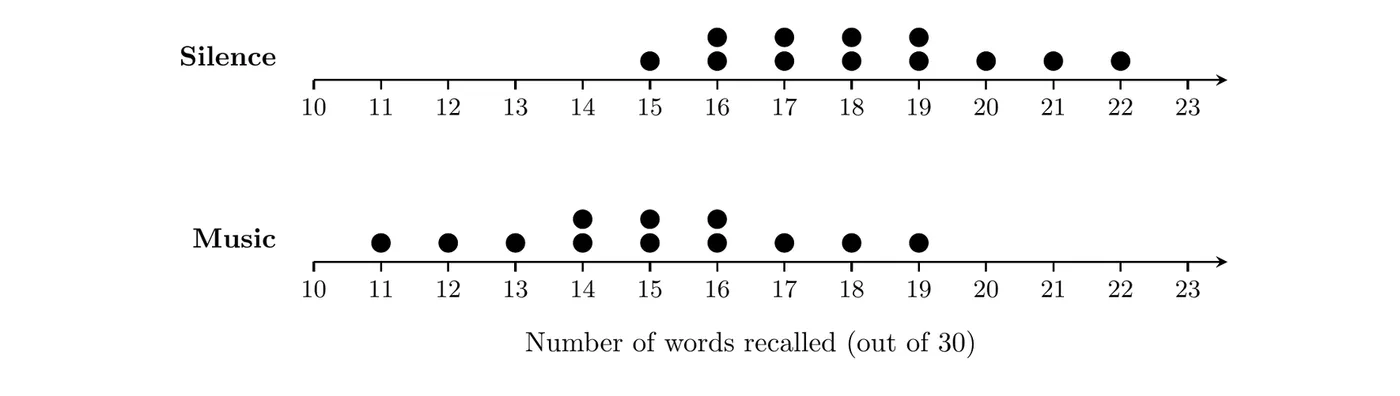
Do: Put each group in a list and run 2-SampTInt with Data. The summary statistics are , , , and words.
With df from the calculator, :
Without technology, df and , which gives , or .
Conclude: We are 95% confident that the interval from 1.26 to 5.08 words captures the true difference in mean number of words recalled (silence minus music) for people like these volunteers. The whole interval is above 0, so the data give convincing evidence that studying in silence leads to more words recalled on average than studying with music. Because the treatments were randomly assigned, this supports a cause-and-effect conclusion, but only for people like these volunteers, since they weren't a random sample from a larger population.
Common mistakes
- Using a two-sample interval on paired data (or the reverse). Check for natural pairs before choosing.
- Turning pooling on in the calculator. Leave Pooled: No.
- Using the largest df by hand. The value is the largest possible df, and it makes the interval too narrow. By hand, use the smaller of and .
- Checking the sample data condition for only one group, or writing "" when one of the samples is smaller than 30.
- Calling it a -interval or using . The population standard deviations are unknown, so it's a -interval.
- Not stating the order of subtraction. Without it, the sign of the interval means nothing.