

4.5 - Carrying Out a Test for a Population Mean or Population Mean Difference
Overview
Once a test is set up (Topic 4.4), you carry it out: compute the test statistic, find the -value, compare the -value to the significance level, and state a conclusion in context. This page finishes the bottle and caffeine tests from Topic 4.4 and shows how to read computer output.
The test statistic
This is the formula sheet's standardized test statistic: (statistic minus parameter) divided by (standard error of the statistic). The numerator is how far the sample mean is from the null value. The denominator is how far typically falls from just by chance. So counts how many standard errors is from .
For matched pairs, use the differences: , where is the number of pairs.
When the null hypothesis is true (and the conditions are met), this statistic has a -distribution with degrees of freedom. That's the distribution you use to find the -value.
Finding the -value
The -value is the probability of getting a test statistic as extreme as the one observed, or more extreme, in the direction of the alternative hypothesis, assuming the null hypothesis is true. It's an area under the -curve with df:
Alternative hypothesis | -value |
Area to the left of | |
Area to the right of | |
Twice the area beyond (both tails) |
- Technology: on a TI-84,
tcdf(lower, upper, df)gives an area, for exampletcdf(-1E99, -2.64, 24). Or run STAT, TESTS,2:T-Test, which reports , the -value, , , and .
- Table B: in your df row, find the two critical values that falls between. The tail probabilities at the top of those columns bound the -value. For a two-sided test, double them.
Interpreting the -value
An interpretation must say that the -value was computed assuming the null hypothesis is true, with the null value in context. A template:
Assuming the true mean [context] is [null value], there is about a [-value] probability of getting a sample mean of [observed value] or [more extreme, in the direction of the alternative], just by chance.
A small -value means the observed result would rarely happen if were true, so it's evidence for . A -value that isn't small means the result is the kind of thing that happens by chance when is true, so it isn't convincing evidence for . It also isn't evidence that is true.
Making a decision and a conclusion
A formal decision compares the -value to the significance level (given in the problem, or chosen before the study):
- If -value : reject . There is convincing statistical evidence for .
- If -value : fail to reject . There is not convincing statistical evidence for .
Then write the conclusion in context. It should:
- compare the -value to explicitly ("Because the -value of 0.007 is less than ..."),
- be stated in terms of the alternative hypothesis,
- refer to the parameter and the population, and
- use non-definitive language: "there is convincing evidence that..." Never write "this proves" or "accept ."
The conclusion is the statistical answer to the investigative question that started the study (is the machine underfilling? does caffeine change reaction time?).
Example 1: Are bottles underfilled? (finishing the test)
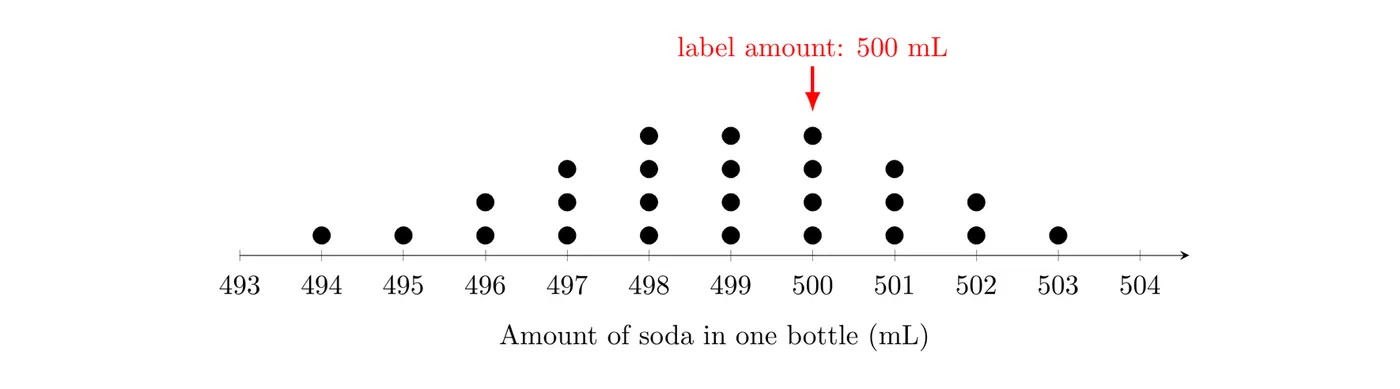
From Topic 4.4: an inspector randomly selects 25 of the 8,000 bottles a machine filled today to test whether the machine underfills. The sample mean is mL and the sample standard deviation is mL. Use .
State: and , where is the true mean amount of soda (mL) in all bottles filled by this machine today. Use .
Plan: One-sample -test for a population mean. Randomization: the 25 bottles were a random sample. 10%: . Sample data: , but the dotplot is roughly symmetric with no outliers.
Do:
The -value is the area to the left of under the -distribution with 24 df, which is about 0.007 (
tcdf(-1E99, -2.64, 24)). With Table B, 2.64 falls between 2.492 (tail probability 0.01) and 2.797 (tail probability 0.005), so the -value is between 0.005 and 0.01.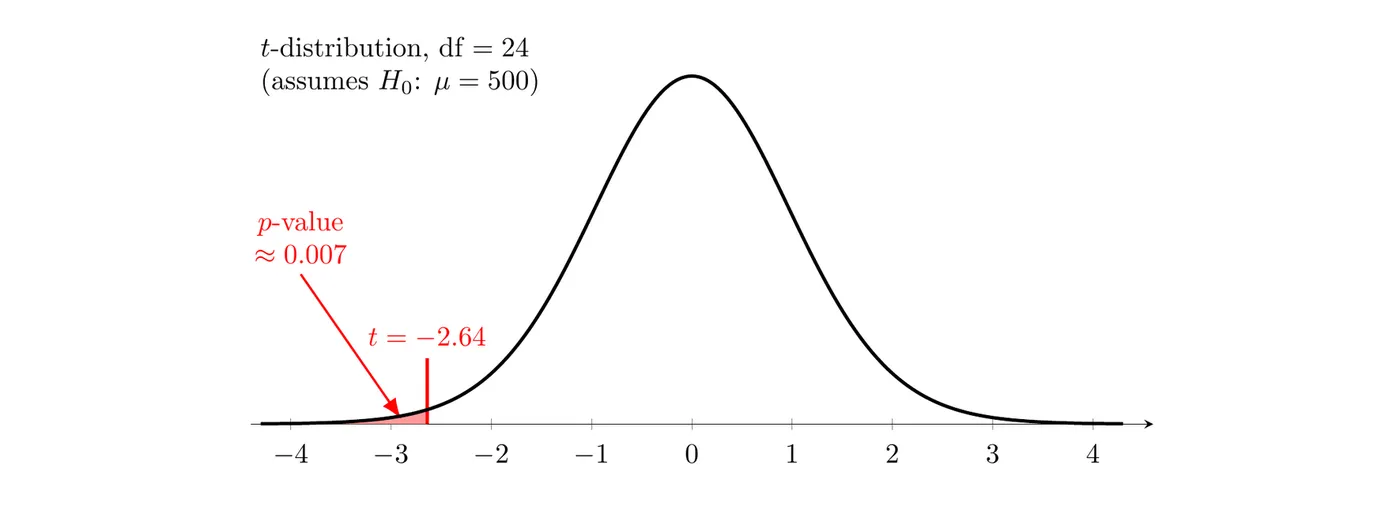
Interpret the -value: Assuming the true mean amount of soda in today's bottles is 500 mL, there is about a 0.007 probability of getting a sample mean of 498.8 mL or less in a random sample of 25 bottles, just by chance.
Conclude: Because the -value of 0.007 is less than , we reject . There is convincing statistical evidence that the true mean amount of soda in all bottles filled by this machine today is less than 500 mL.
Example 2: Caffeine and reaction time (finishing the test)
From Topic 4.4: 14 volunteers each took a reaction-time test after a caffeine pill and after a placebo, in random order. For the 14 differences (caffeine minus placebo), ms and ms. Test at whether caffeine changes mean reaction time.
State: and , where is the true mean difference in reaction time (caffeine minus placebo, in ms) for adults like these volunteers. Use .
Plan: One-sample -test for a population mean difference (paired). Randomization: the order of the pills was randomly assigned. 10%: doesn't apply to an experiment. Sample data: the dotplot of the 14 differences is roughly symmetric with no outliers.

Do:
The alternative is two-sided, so the -value is the area beyond 2.50 in both tails. Each tail has area about 0.0133, so the -value is about . With Table B (df = 13), 2.50 falls between 2.282 (tail probability 0.02) and 2.650 (tail probability 0.01), so one tail is between 0.01 and 0.02 and the two-sided -value is between 0.02 and 0.04.
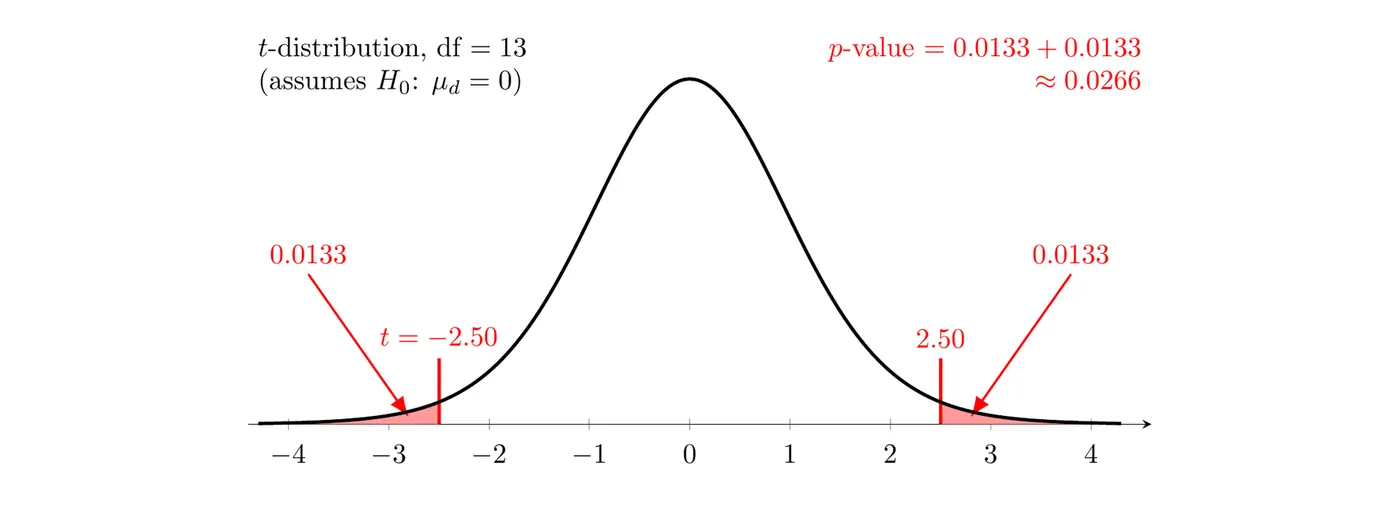
Interpret the -value: Assuming caffeine has no effect on the mean reaction time of adults like these (), there is about a 0.027 probability of getting a mean difference at least 9.29 ms away from 0, in either direction, just by chance.
Conclude: Because the -value of 0.027 is less than , we reject . There is convincing statistical evidence that caffeine changes the true mean reaction time for adults like these volunteers. The sample mean difference is negative, so the data suggest caffeine lowers (speeds up) reaction time, and because the order of the pills was randomly assigned, we can attribute the difference to the caffeine.
Two side notes. At , the same -value would lead to failing to reject , which is why is set before the data are analyzed. And a 95% confidence interval for , ms, doesn't contain 0, which agrees with rejecting in a two-sided test at .
Example 3: Reading computer output (AP-style)
A researcher wonders whether students at a large high school (2,100 students) average more than 7 hours of screen time per day. She takes a random sample of 35 students. A dotplot of their screen times is moderately skewed to the right with no outliers. Software gives this output for and , where is the true mean daily screen time (hours) for all students at the school:
Variable | N | Mean | StDev | SE Mean | T | P |
Screen time (hours) | 35 | 7.42 | 1.96 | 0.331 | 1.27 | 0.107 |
(a) Are the conditions met? (b) Interpret the -value. (c) What should she conclude at ?
(a) Yes. Randomization: random sample of students. 10%: . Sample data: the data are skewed, but , so the sampling distribution of is approximately normal.
(b) The output's test statistic is with df = 34, and the -value is 0.107. Assuming the true mean daily screen time for students at this school is 7 hours, there is about a 0.107 probability of getting a sample mean of 7.42 hours or more in a random sample of 35 students, just by chance.
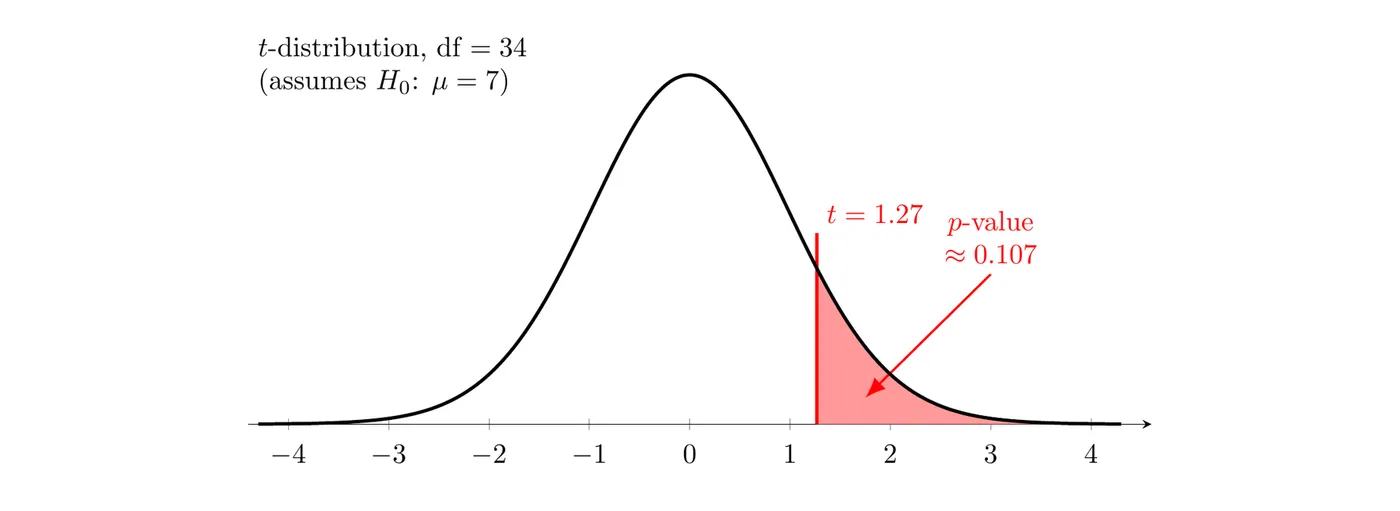
(c) Because the -value of 0.107 is greater than , we fail to reject . There is not convincing statistical evidence that the true mean daily screen time for students at this school is more than 7 hours.
This does not show the mean is exactly 7 hours. A sample mean of 7.42 hours happens fairly often by chance when , so the data just aren't strong enough to rule 7 out.
Errors to keep in mind
Any decision from a test can be wrong, and Topic 3.8 covers both errors in full. Example 1 rejected , so the only possible error there is a Type I error: concluding the machine underfills when its true mean really is 500 mL. Example 3 failed to reject , so the only possible error is a Type II error: missing that the true mean screen time really is above 7 hours.
Common mistakes
- Using
normalcdfor Table A for a statistic, or using the wrong df.
- Forgetting to double the tail area for a two-sided alternative.
- Interpreting the -value as the probability that is true. It's computed by assuming is true.
- Concluding without comparing the -value to , or writing "accept " or "proves."
- Stopping at "reject " with no context, parameter, or population.
- For paired data, running a two-sample test, or mixing up the order of subtraction when reading the sign of .