

4.9 - Setting Up a Test for the Difference Between Two Population Means
Overview
A two-sample -test checks whether data give convincing evidence of a difference between two population means. This topic is the setup: choosing the test, defining the parameters, writing the hypotheses, and checking the conditions. Topic 4.10 carries the test out. On the exam, a question that asks whether the data provide "convincing statistical evidence" of a difference in means is asking for a significance test, not just a comparison of the sample means.
Choosing the test
The appropriate test for the difference between two population means is a two-sample -test for a difference between two population means. Use it when the response variable is quantitative, the data come from two independent random samples or two groups in a randomized experiment, and the question asks for evidence about a difference.
Data | Test |
One sample, quantitative variable | One-sample -test for (Topic 4.4) |
Paired data: the same subjects twice, or matched pairs | One-sample -test for , on the differences (Topic 4.4) |
Two independent samples or groups, quantitative variable | Two-sample -test for |
Two independent samples or groups, categorical variable | Two-sample -test for (Topic 3.12) |
Why and not ? The population standard deviations are unknown, so the test uses and in their place, and the test statistic follows a -distribution instead of the standard normal.
Defining the parameters
Define each parameter with three things: the population parameter (the true mean), the response variable, and the population, all in context. For example:
= the true mean session length, in minutes, for all phone players of the game; = the true mean session length, in minutes, for all console players of the game.
Descriptive subscripts like and are clearer than and , and either is fine. The hypotheses must be about these parameters, never the sample means and . You already know the sample means; the question is about the populations.
Writing the hypotheses
The null hypothesis says there's no difference between the population means. Either form works:
The alternative hypothesis matches the research question:
The question asks whether | Equivalent form | |
population 1 has the larger mean | ||
population 1 has the smaller mean | ||
the means differ, in either direction |
Choose the direction from the question, before looking at the data. Words like "more," "higher," "increase," or "longer" point to a one-sided test. "Different" or "changed" point to a two-sided test. Watch the order of subtraction too: if the question is whether group 2 has the larger mean, then is correct, and so is . Pick one order and keep it through the whole test.
Checking the conditions
A two-sample -test needs the same three conditions as the two-sample -interval:
- Randomization condition: the data should be collected using two independent random samples or a randomized experiment.
- 10% condition: when sampling without replacement, each sample size must be at most 10% of its population size: and . This condition isn't needed for a randomized experiment.
- Sample data condition: both and , or it's stated that both population distributions are approximately normal. If either sample size is less than 30, graphs of both samples should show no strong skewness and no outliers.
Name each condition and connect it to the context with numbers. Common errors include mislabeling conditions (like calling the 10% condition the randomization condition), vague references to the normal distribution, and applying the sample data condition incorrectly, such as checking only one group or writing "" when a sample is smaller than 30.
Example 1: Phone and console players
A game company wants to know whether the mean session length differs between players on phones and players on consoles. It selects a random sample of 50 phone players and an independent random sample of 42 console players from its millions of users and records the length of each player's most recent session, in minutes. Session lengths are skewed to the right. Set up the appropriate test at .
State: the company asks whether the means differ, so the test is two-sided.
where = the true mean session length, in minutes, for all phone players of this game and = the true mean session length for all console players of this game. Use .
Plan: two-sample -test for a difference between two population means. Session length is quantitative, and the two samples are independent. Check the conditions:
- Randomization: two independent random samples, one of phone players and one of console players.
- 10%: 50 and 42 are each far less than 10% of the millions of phone and console players.
- Sample data: session lengths are skewed, but and , so the sampling distribution of is approximately normal.
All three conditions are met. Topic 4.10, Example 2 carries out this test.
Example 2: Plant food for bean plants (AP-style)
A biology class wants to know whether a new plant food makes bean plants grow taller. They randomly assign 24 bean seedlings to two groups of 12. One group gets the plant food mixed into its water and the other gets plain water; light, soil, and pot size are the same for all plants. Heights after three weeks, in cm:
Group | Heights (cm) |
Plant food | 23.1, 25.4, 21.8, 26.0, 24.7, 22.9, 27.3, 24.2, 25.8, 23.6, 26.5, 24.9 |
Water only | 22.6, 23.9, 21.3, 24.8, 23.0, 20.9, 25.1, 22.7, 23.8, 21.9, 24.4, 23.2 |
Identify the appropriate test, state the hypotheses, and check the conditions.
State: the class wants to know whether the plant food makes plants taller, so the test is one-sided.
where = the true mean height after three weeks for bean plants like these grown with the plant food and = the true mean height after three weeks for bean plants like these grown with plain water.
Plan: two-sample -test for a difference between two population means. Height is quantitative, and the two groups were formed by random assignment, so they're independent (no plant is in both groups and there's no pairing). Check the conditions:
- Randomization: the treatments were randomly assigned to the seedlings.
- 10%: not needed, because this is a randomized experiment, not a sample from a population.
- Sample data: both groups have 12 plants, fewer than 30, so check both samples. The five-number summaries are 21.8, 23.35, 24.8, 25.9, 27.3 cm (plant food) and 20.9, 22.25, 23.1, 24.15, 25.1 cm (water). By the rule, the outlier fences are 19.525 and 29.725 cm for plant food and 19.4 and 27.0 cm for water, so neither group has outliers. The boxplots show no strong skewness.
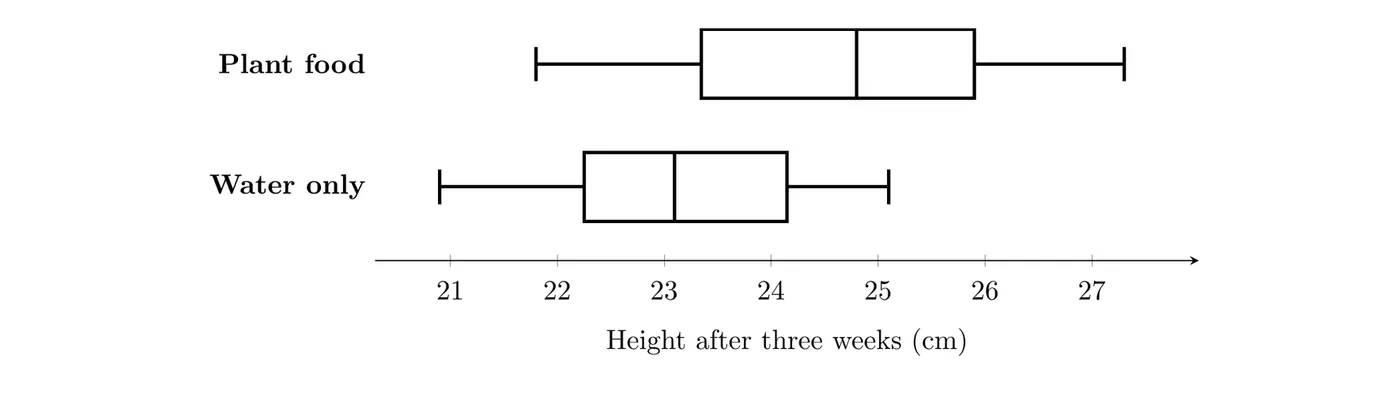
All conditions are met, so a two-sample -test is appropriate. Topic 4.10, Example 1 finishes this test.
Example 3: Two samples or paired?
Identify the procedure for each study.
- Each of 25 students takes a reading test before and after a summer program. Is the mean score higher after the program?
- Paired -test (a one-sample -test for ). Each student gives two related scores, so analyze the 25 differences.
- A vet clinic takes a random sample of 40 dog owners and a separate random sample of 40 cat owners and records each owner's yearly vet spending. Do dog owners spend more on average?
- Two-sample -test for . Two separate groups and a quantitative response.
- The same clinic records whether each owner bought pet insurance. Do the proportions who buy insurance differ?
- Two-sample -test for . The response (bought insurance or not) is categorical (Topic 3.12).
The giveaway for paired data is a natural partner for each value in the other group. Equal sample sizes alone don't make data paired.
Common mistakes
- Writing hypotheses about statistics, like . Hypotheses are always about parameters.
- Using a two-sample test on paired data. If each value has a natural partner, analyze the differences.
- Choosing the direction after seeing the data. The direction of comes from the question, not from which sample mean turned out bigger.
- Vague parameters, like " = phones." Include the true mean, the variable, and the population.
- Mismatched order of subtraction between the parameter definitions and .
- Requiring the 10% condition in an experiment, or claiming when a group is smaller than 30.