

3.15 - Rates of Change in Polar Functions
Overview
In a polar function , the output is a signed radius, so when changes, the point on the graph moves toward or away from the origin. This topic is about reading those changes: when the distance from the origin is increasing or decreasing, which points are farthest from or closest to the origin, and how fast changes per radian.
Distance from the origin
The point is units from the origin. So the question “is the point moving away from the origin?” really asks “is getting bigger?” That depends on both the sign of and the direction it's changing.
If is | and is | then is | so the distance from the origin is |
positive | increasing | increasing | increasing |
negative | decreasing | increasing | increasing |
positive | decreasing | decreasing | decreasing |
negative | increasing | decreasing | decreasing |
Shortcut: if the sign of and its direction of change agree (positive and increasing, or negative and decreasing), the point moves away from the origin. If they disagree, it moves toward the origin.
The negative cases are where students slip. If goes from to , then is decreasing, but the point goes from 1 unit away to 3 units away. It is moving away.
Example 1: Four intervals of
For , describe how the distance between the point and the origin changes on each interval.
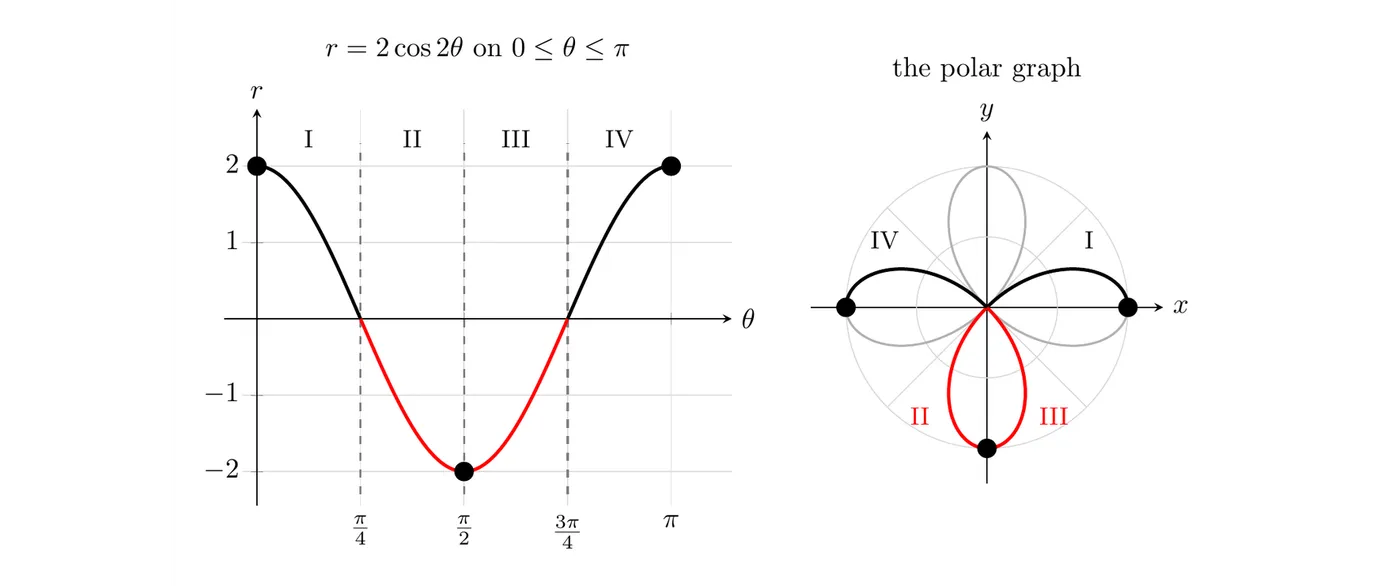
Interval | is | Distance from the origin |
I: | positive, decreasing (2 to 0) | decreasing |
II: | negative, decreasing (0 to ) | increasing |
III: | negative, increasing ( to 0) | decreasing |
IV: | positive, increasing (0 to 2) | increasing |
In the polar graph, interval I moves along the right petal into the origin. Intervals II and III (red, where ) go out to the tip of the bottom petal at and back. Interval IV moves out along the left petal to .
Relative extrema: Farthest and closest points
If changes from increasing to decreasing, or from decreasing to increasing, then has a relative extremum there. That point is relatively farthest from or relatively closest to the origin. Which one depends on the sign of :
Relative extremum of | Sign of | The point is relatively |
maximum | positive | farthest from the origin |
minimum | positive | closest to the origin |
minimum | negative | farthest from the origin |
maximum | negative | closest to the origin |
In Example 1, is a relative minimum of (where ), yet it's the tip of the bottom petal, one of the points farthest from the origin. A negative minimum has the largest size, .
Points where are as close to the origin as possible (distance 0), even though usually isn't at an extremum there. It's just changing sign.
Example 2: Giving a reason (AP-style)
Let , the limaçon from Topic 3.14.
(a) On the interval , is the distance between the point and the origin increasing or decreasing? Give a reason.
On this interval , so . Cosine is decreasing on , so is decreasing too. The distance is increasing, because is negative and decreasing on this interval.
(b) has a relative minimum at . What does that tell you about the point ?
, which is negative. A relative minimum with a negative value is relatively farthest from the origin. It's the point , the tip of the inner loop, 1 unit from the origin.
A complete reason names both facts: the sign of and whether is increasing or decreasing. Saying only “ is decreasing” is not enough.
Average rate of change of
The average rate of change of with respect to over an interval is the change in the signed radius divided by the change in angle:
Its units are radius units per radian. On the graph of versus , it is the slope of the secant line between the two points. It tells you how fast the signed radius changes, on average, as the angle sweeps from to .
Be careful with the interpretation. A positive average rate of change means increased on average. The point moved away from the origin only if was positive.
Example 3: Computing and using the average rate of change
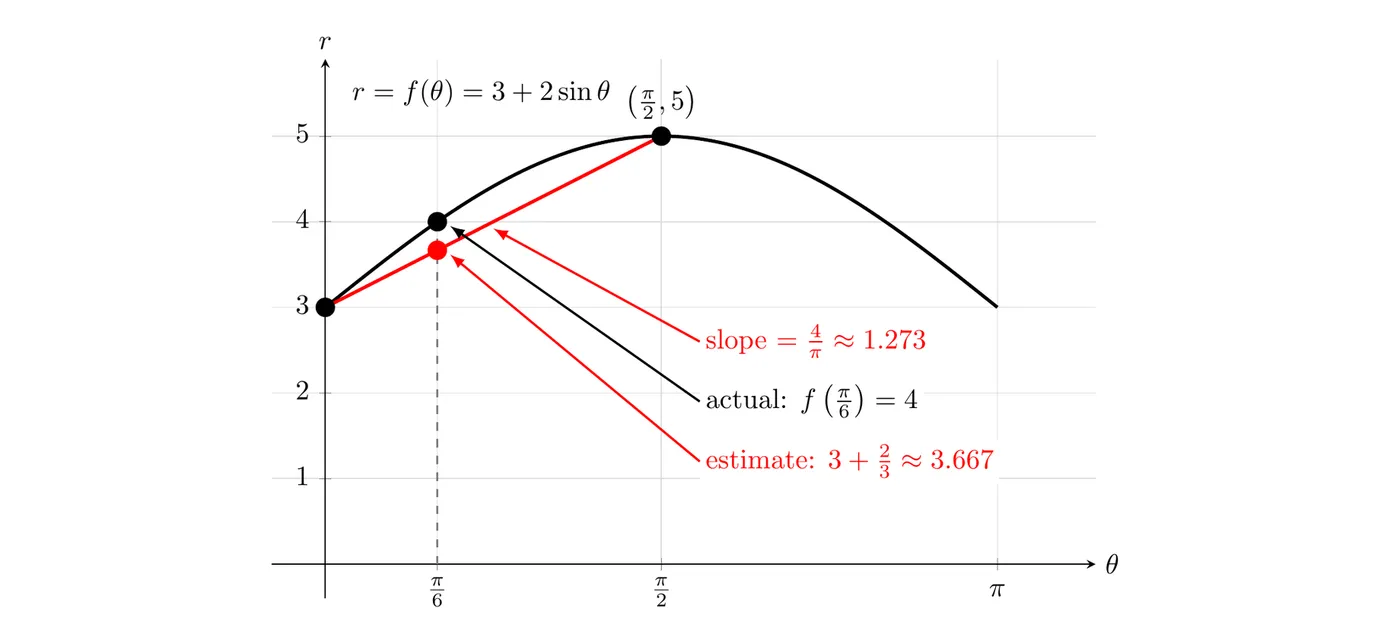
Let .
(a) Find the average rate of change of over , and interpret it.
On average, the radius increases by about 1.273 units per radian as goes from 0 to .
(b) Use this average rate of change to estimate .
Start at the known point and move along the secant line:
The actual value is . The estimate is a little low because the graph bends above the secant line on this interval.
Example 4: Working from a table (AP-style)
Selected values of a polar function are shown. The function is continuous, increasing for , and decreasing for .
(a) Find the average rate of change of over .
The signed radius decreases by about 1.910 units per radian, on average, over this interval.
(b) Use it to estimate .
(c) On , is the point moving toward or away from the origin?
It depends on where you are in the interval. starts positive (2.5) and ends negative (), so it passes through 0 somewhere in between. While is positive and decreasing, the point moves toward the origin. After it passes through the origin, is negative and decreasing, so the point moves away from the origin.
Common mistakes
- Ignoring the sign of . Knowing that is decreasing isn't enough to say the point moves toward the origin. Check whether is positive or negative first.
- Calling every relative minimum the closest point. If is negative at a relative minimum, that point is relatively farthest from the origin.
- Mixing up rate of change and distance. A negative average rate of change means decreased, not that the point got closer to the origin.
- Using degrees. The average rate of change is per radian, so the change in must be in radians.