

2.2 - Summary Statistics for Two Categorical Variables
Overview
A two-way table is full of counts. This topic turns those counts into three kinds of proportions: joint, marginal, and conditional relative frequencies. They differ only in the denominator, so the whole skill is choosing the right total to divide by. Conditional relative frequencies are the ones that let you check for an association and back up a claim with numbers.
The data
A researcher surveyed a random sample of 500 students at a large high school. Each student was asked whether they usually keep their phone in their bedroom overnight ("Phone: yes" or "Phone: no") and about how many hours they sleep on a school night.
Less than 7 h | 7 to 8 h | More than 8 h | Total | |
Phone: yes | 135 | 120 | 45 | 300 |
Phone: no | 40 | 90 | 70 | 200 |
Total | 175 | 210 | 115 | 500 |
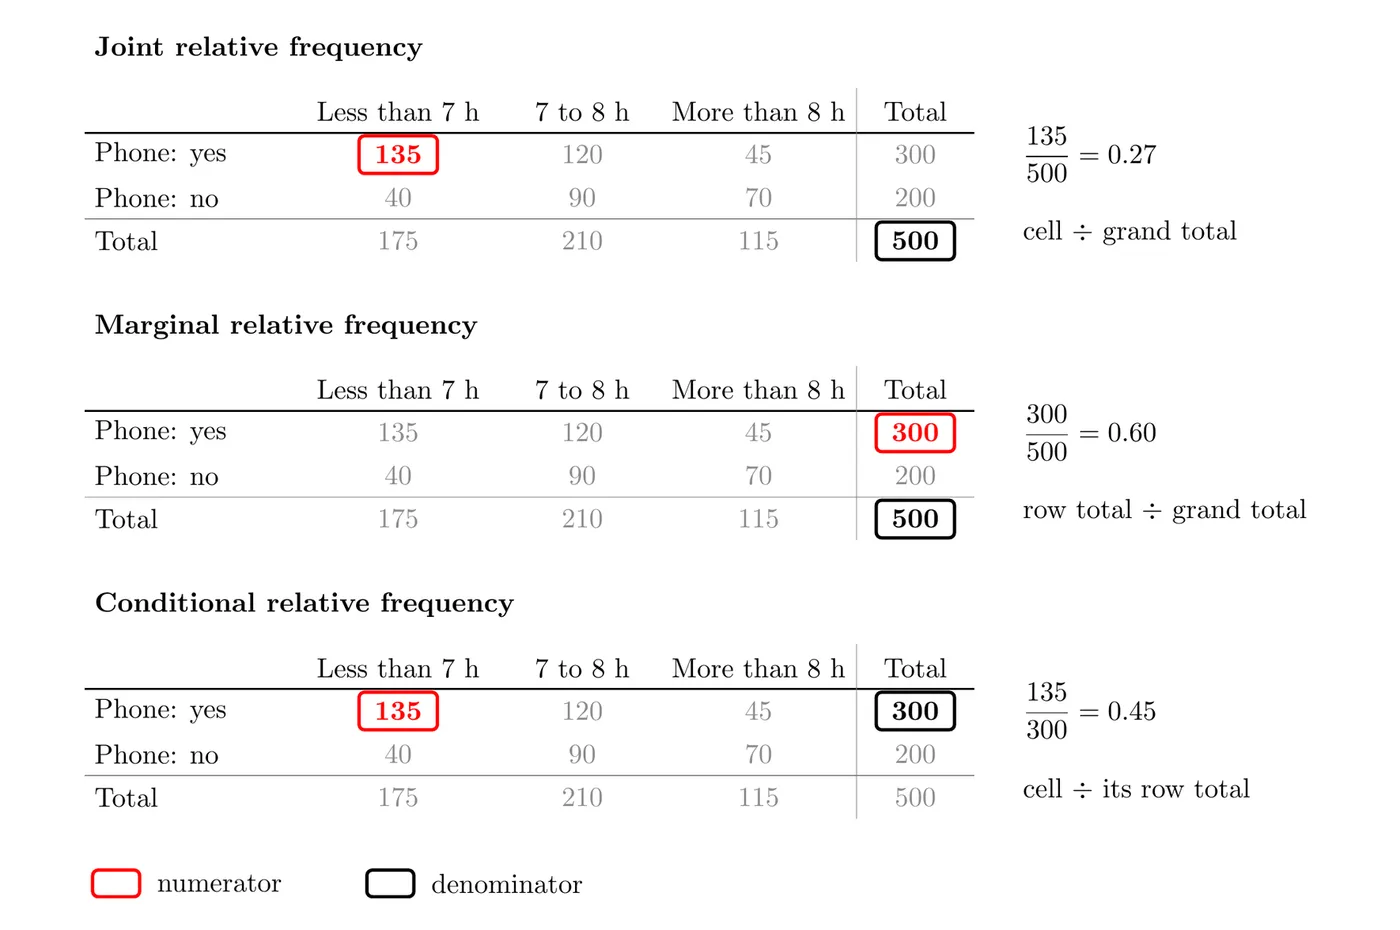
Each type of relative frequency answers a different question about the same table. The figure shows the numerator (red) and the denominator (black box) for each one.
Joint relative frequency
A joint relative frequency is a cell count divided by the total for the entire table:
It answers "what proportion of everyone is in this row category and this column category?"
Interpretation: 27% of the students surveyed keep their phone in their bedroom and sleep less than 7 hours on a school night.
Dividing every cell by 500 gives the joint relative frequencies for the whole table. The six cells add up to 1, because every student is in exactly one cell.
Less than 7 h | 7 to 8 h | More than 8 h | Total | |
Phone: yes | 0.27 | 0.24 | 0.09 | 0.60 |
Phone: no | 0.08 | 0.18 | 0.14 | 0.40 |
Total | 0.35 | 0.42 | 0.23 | 1.00 |
Marginal relative frequency
A marginal relative frequency is a row total or a column total divided by the total for the entire table. The name comes from where these totals sit: in the margins of the table.
It describes one variable by itself, ignoring the other.
Interpretation: 60% of the students surveyed keep their phone in their bedroom, and 35% sleep less than 7 hours on a school night.
The full set of marginal relative frequencies for one variable is its marginal distribution. For sleep it's 0.35, 0.42, and 0.23 (the bottom row of the joint table above), which adds to 1.
Marginal relative frequencies alone can't tell you whether the two variables are associated, since they look at only one variable at a time.
Conditional relative frequency
A conditional relative frequency restricts attention to one category of one variable and asks what proportion of that group falls in a category of the other variable. It can be:
- a cell count divided by its row total, or
- a cell count divided by its column total.
Restricting to the 300 students with a phone in their bedroom (a row):
Interpretation: among students who keep their phone in their bedroom, 45% sleep less than 7 hours.
Restricting to the 175 students who sleep less than 7 hours (a column):
Interpretation: among students who sleep less than 7 hours, about 77.1% keep their phone in their bedroom.
Same numerator, different denominators, different questions, different answers. The group you are restricting to is always the denominator. Watch for these phrases:
- "Of the students who keep their phone in their bedroom, what proportion..."
- "Among students who sleep less than 7 hours..."
- "Given that a student has no phone in the bedroom..."
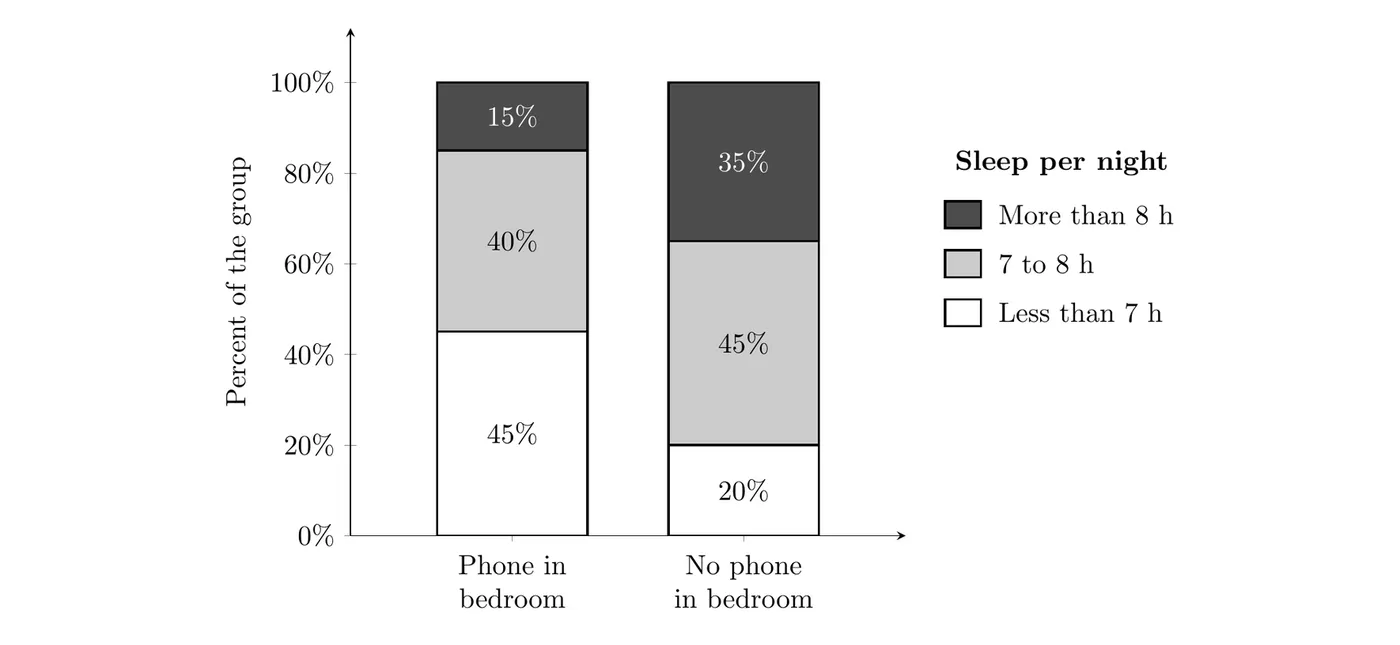
The conditional relative frequencies for one group form its conditional distribution. Here are the conditional distributions of sleep for each phone group (divide each cell by its row total):
Less than 7 h | 7 to 8 h | More than 8 h | Total | |
Phone: yes | 135/300 = 0.45 | 120/300 = 0.40 | 45/300 = 0.15 | 1.00 |
Phone: no | 40/200 = 0.20 | 90/200 = 0.45 | 70/200 = 0.35 | 1.00 |
Summary of the three types
Type | Numerator | Denominator | Example | Answers |
Joint | One cell | Grand total | 135/500 = 0.27 | Phone and less than 7 h, out of everyone |
Marginal | A row or column total | Grand total | 300/500 = 0.60 | Phone, out of everyone |
Conditional | One cell | Its row or column total | 135/300 = 0.45 | Less than 7 h, out of the phone group only |
Comparing conditional distributions to check for association
Two categorical variables are associated when the conditional distribution of one variable is different across the categories of the other. If the conditional distributions are the same (or nearly the same), there's no association.
Compare the two phone groups category by category:
- Less than 7 hours: 45% of students with a phone in the bedroom vs. 20% of students without one.
- More than 8 hours: 15% vs. 35%.
The conditional distributions are clearly different, so phone location and sleep are associated in this sample: students who keep their phone in their bedroom tend to sleep less.
A useful benchmark is the marginal distribution. Overall, 35% of the students sleep less than 7 hours. If there were no association, both phone groups would be close to 35%. Instead, the phone group is well above it (45%) and the no-phone group is well below it (20%).
Justifying a claim
Summary statistics like these are the evidence for claims about the variables in context. Use the same three steps as Topic 2.1 (quote the values for each group, compare them, conclude in context), and make sure each proportion has the denominator the claim is really about. Then check what kind of claim it is:
- A claim of association ("students with phones in their rooms tend to sleep less") is supported when the conditional relative frequencies differ.
- A claim of cause and effect ("phones in bedrooms cause students to sleep less") needs a randomized experiment. This survey is an observational study, so it can't rule out other explanations. Maybe students who already stay up late are the ones who keep their phones nearby.
- A claim about a larger population ("this is true for all students at the school") needs a random sample. This sample was random, so the association can reasonably be extended to the school. Whether a difference is too big to be due to chance alone gets a formal test in Unit 3.
Example 1: Same numerator, four questions
Use the phone and sleep table. Find and interpret each value.
(a) The proportion of students who sleep more than 8 hours.
This is about everyone, and only one variable, so it's marginal:
23% of the students surveyed sleep more than 8 hours on a school night.
(b) The proportion of students without a phone in their bedroom who sleep more than 8 hours.
Restricted to the 200 students without a phone in the bedroom, so it's conditional (row):
Among students without a phone in their bedroom, 35% sleep more than 8 hours.
(c) The proportion of students who sleep more than 8 hours and don't keep a phone in their bedroom.
Both conditions, out of everyone, so it's joint:
14% of the students surveyed sleep more than 8 hours and don't keep a phone in their bedroom.
(d) The proportion of students who sleep more than 8 hours who don't keep a phone in their bedroom.
Restricted to the 115 students who sleep more than 8 hours, so it's conditional (column):
Among students who sleep more than 8 hours, about 60.9% don't keep a phone in their bedroom.
All four answers use the same cell (70). Only the denominator changes, and it comes straight from the wording of the question.
Example 2: Reminder texts and flu shots (AP-style)
A health clinic randomly assigned 600 patients to one of three groups: no reminder, a generic text reminder, or a personalized text reminder that used the patient's name and their doctor's name. The clinic recorded whether each patient got a flu shot within one month.
Got a flu shot | No flu shot | Total | |
No reminder | 60 | 190 | 250 |
Generic text | 64 | 136 | 200 |
Personalized text | 63 | 87 | 150 |
Total | 187 | 413 | 600 |
(a) What proportion of all the patients got a flu shot?
About 31.2% of the patients in the study got a flu shot within one month.
(b) What proportion of all the patients got a personalized text and got a flu shot?
10.5% of the patients got a personalized text and got a flu shot.
(c) Of the patients who got a flu shot, what proportion received a personalized text?
Restrict to the 187 patients who got a flu shot:
About 33.7% of the patients who got a flu shot had received a personalized text.
(d) A staff member says, "Generic texts worked best, because more patients in that group got flu shots than in any other group." Do the data support this claim? Justify your answer.
The count is right (64 is the largest), but the groups are different sizes, so compare the proportion of each group that got a flu shot:
42% of patients who got a personalized text got a flu shot, compared with 32% of patients who got a generic text and 24% of patients with no reminder. The claim is not supported. The personalized text had the highest flu shot rate, not the generic text.
Because the patients were randomly assigned to groups, this is an experiment, so a difference that's too big to be explained by chance would be evidence that the reminders caused the change. In Unit 3 you'll learn a test that checks this. (Differences this large turn out to be very unlikely by chance alone.)
Common mistakes
- Using the wrong denominator. Ask "out of whom?" The group named after "of," "among," or "given that" is the denominator.
- Flipping a conditional. "45% of students with phones in their bedroom sleep less than 7 hours" is not the same as "77.1% of students who sleep less than 7 hours have phones in their bedroom."
- Using marginal relative frequencies to judge association. You need to compare conditional relative frequencies across groups.
- Comparing counts instead of proportions when the groups have different sizes.
- Concluding cause and effect from an observational study. Only a randomized experiment supports a cause-and-effect claim.
- Leaving out context. "0.45" alone earns little. Say who the 45% are and what they do.