

2.6 - Conditional Probability
Overview
A conditional probability is a probability that uses extra information: you already know one event happened, so you only look at the outcomes where it did. This topic covers the conditional probability formula and the general multiplication rule, which turns that formula around to find the probability that two events both happen. These are the tools behind tree diagrams, reading medical test results, and checking independence in Topic 2.7.
What "given" means
is read "the probability of given ." It's the probability that happens when you know that has happened. The vertical bar means given, and the event after the bar is the condition.
Knowing that happened shrinks the sample space. Every outcome outside is ruled out, and becomes the new whole. So asks: out of the outcomes in , what fraction are also in ?
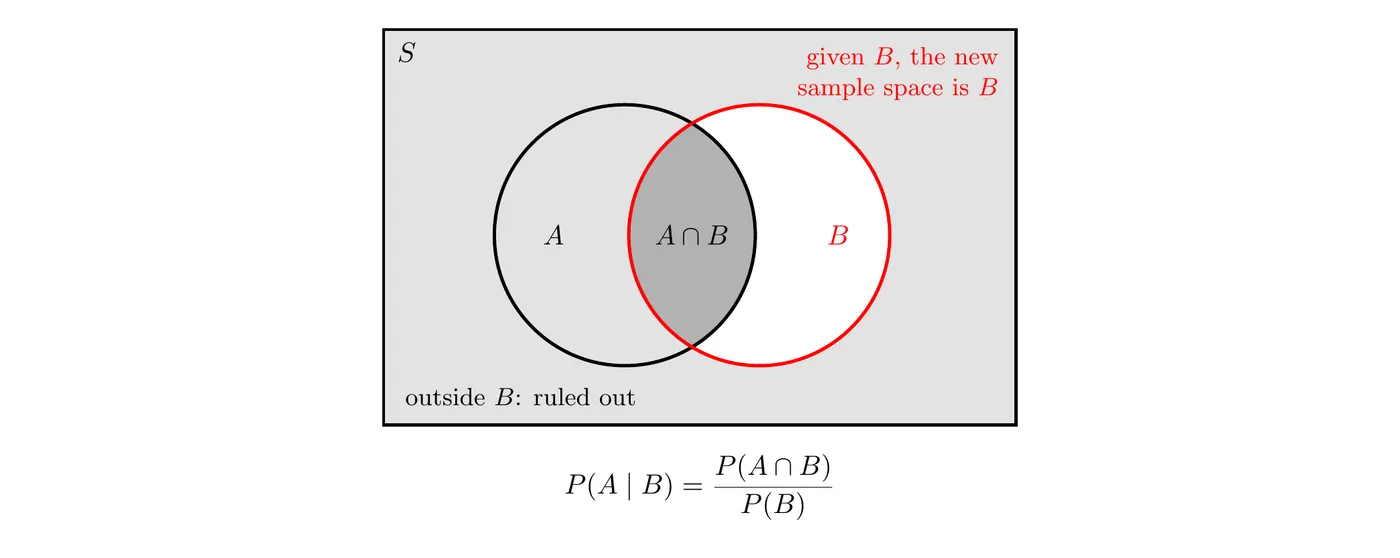
In a two-way table, this means you stop using the grand total and use only the row or column for the condition. That's the conditional relative frequency from Topic 2.2.
Example 1: Conditional probability from a two-way table
Here again is the survey of all 400 seniors at a high school from Topic 2.5.
Job | No job | Total | |
License | 126 | 114 | 240 |
No license | 34 | 126 | 160 |
Total | 160 | 240 | 400 |
One senior is chosen at random. Let = "has a license" and = "has a job."
(a) Find .
Step 1: The condition is , so restrict to the License row. It has 240 seniors.
Step 2: Of those 240 seniors, 126 have a job.
Given that a senior has a license, the probability that they have a part-time job is . So 52.5% of seniors with a license have a job.
(b) Find .
Step 1: Now the condition is , so restrict to the Job column. It has 160 seniors.
Step 2: Of those 160 seniors, 126 have a license.
Given that a senior has a part-time job, the probability that they have a license is about . About 78.8% of seniors with a job have a license.
Notice: and use the same cell (126) but different totals, so they're different. Order matters: the event after the bar decides which total you divide by.
The conditional probability formula
When you have probabilities instead of counts, use the formula from the AP formula sheet:
This works whenever (you can't condition on something impossible). It's the same idea as the table: the joint probability is the part of that's also in , and is the new whole. Example 1 gives the same answer with the formula:
The complement rule from Topic 2.4 still works inside a condition: . Once you know happened, either happens or it doesn't.
Example 2: Using the formula
At a large university, 60% of students live on campus, 55% have a meal plan, and 48% live on campus and have a meal plan. A student is chosen at random. Let = "lives on campus" and = "has a meal plan."
(a) Find the probability that the student has a meal plan, given that they live on campus.
Among students who live on campus, 80% have a meal plan.
(b) Find the probability that the student does not have a meal plan, given that they live on campus.
Among students who live on campus, 20% don't have a meal plan.
(c) Find the probability that the student lives on campus, given that they have a meal plan.
Among students with a meal plan, about 87.3% live on campus. Again, , because the condition changes the denominator.
The general multiplication rule
Write the formula with as the condition, , and multiply both sides by :
This is the general multiplication rule. In words: the probability that both events happen equals the probability that the first one happens, times the probability that the second one happens given that the first one did. It works for any two events, which is why it's called general. (In Topic 2.7, you'll see the shortcut for independent events, where is just .)
Use it when events happen in a sequence and the first result affects the second, like choosing people or objects without replacement.
Example 3: Choosing without replacement
A class has 12 juniors and 8 seniors. The teacher randomly picks one student to present first, then randomly picks a different student to present second. Find the probability that both presenters are seniors.
Step 1: Find the probability that the first pick is a senior. There are 8 seniors out of 20 students.
Step 2: Find the probability that the second pick is a senior, given that the first one was. Now there are 7 seniors left out of 19 students.
Step 3: Multiply.
Answer: The probability that both presenters are seniors is about .
Tree diagrams
When a random process happens in stages, a tree diagram keeps the conditional probabilities organized.
- The first set of branches shows the first stage. Its probabilities add to 1.
- Each later set of branches shows the next stage, given the branch it grows from. The branches coming out of each point add to 1.
- Multiply along a path to get the probability of that whole path. That's the general multiplication rule.
- Add the paths that lead to the event you want. Different paths can't both happen (they're mutually exclusive), so their probabilities add.
Example 4: A screening test (AP-style)
A disease affects 2% of a large population. A screening test gives a positive result for 95% of people who have the disease. It also gives a positive result for 8% of people who don't have the disease (a false positive). A person is chosen at random and tested. Let = "has the disease" and = "tests positive."
(a) Find the probability that the person tests positive.
(b) Given that the person tests positive, find the probability that they have the disease.
Step 1: Draw the tree. The first stage is disease status. The second stage is the test result, given disease status.
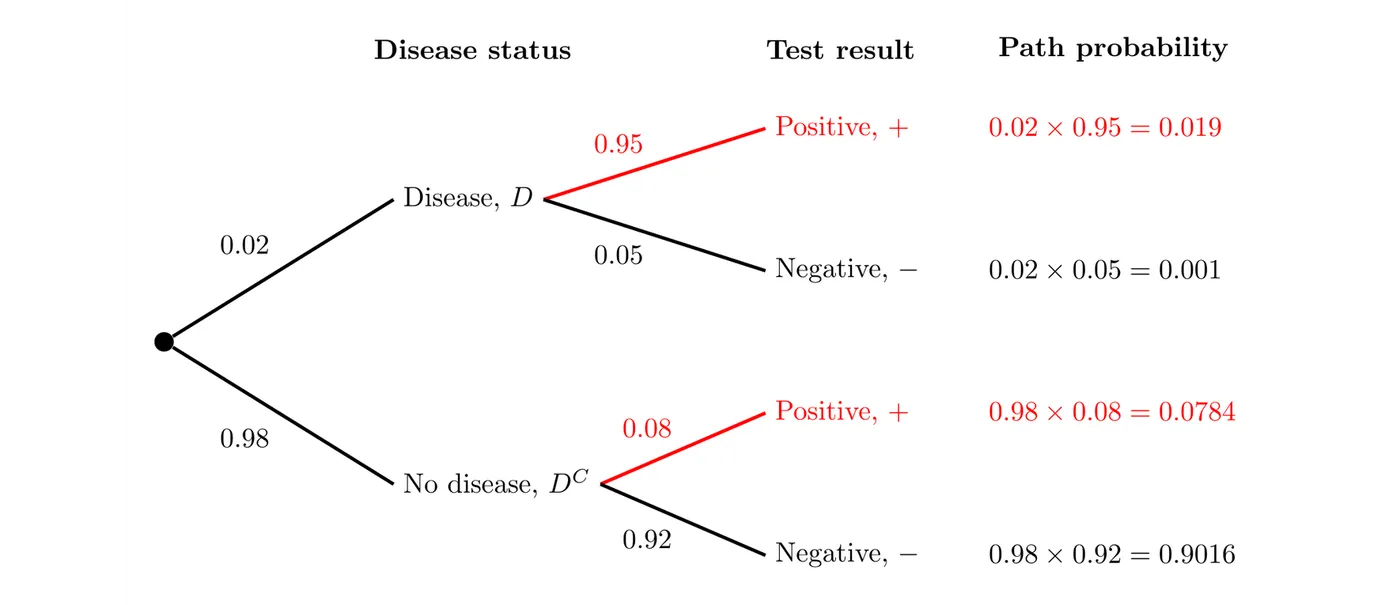
Step 2: Find each path that ends in a positive test (in red) with the general multiplication rule.
Step 3 (a): A positive test can happen on either red path, so add them.
The probability that a randomly chosen person tests positive is .
Step 4 (b): The tree gives , but the question asks for . Use the conditional probability formula.
Answer: Given a positive test, the probability that the person has the disease is only about . Fewer than 1 in 5 people who test positive actually have the disease.
Why so low? Picture 10,000 people. About 200 have the disease, and 190 of them test positive. The other 9,800 don't have it, but 8% of them (784 people) also test positive. Out of positive tests, only 190 are true positives, and . When a condition is rare, false positives from the large healthy group can outnumber the true positives.
Showing your work on the AP exam
On free-response questions, a probability calculation earns full credit when it shows three things:
- The formula or structure, with the events named, for example .
- The numbers from the problem substituted in.
- The answer, interpreted in context.
A bare number, or a calculator result with no setup, can lose credit even when it's correct.
Common mistakes
- Dividing by the grand total. A conditional probability divides by the total for the condition (its row, its column, or ), not by the whole table.
- Flipping the condition. is not the same as . Read which event comes after the bar.
- Putting the wrong event in the denominator. In , you divide by , the probability of the event after the bar.
- Adding along a path or multiplying across paths. Multiply along a single path, and add separate paths.
- Forgetting that the second draw changes. Without replacement, the second probability is conditional: , not .