

2.4 - Introduction to Probability
Overview
In Topic 2.3 you estimated probabilities by repeating a random process many times. When all the outcomes are equally likely, you can find the exact probability by counting. This topic sets up the rules every later probability calculation uses: the sample space, the counting formula, the fact that probabilities run from 0 to 1, and the complement rule.
The sample space
The sample space of a random process, written , is the set of all possible nonoverlapping outcomes. Nonoverlapping means every trial produces exactly one outcome from the list. One of them must happen, so the probability of the sample space is 1:
- Flip a coin:
- Roll a six-sided die:
- Flip a coin twice: . HT (heads, then tails) and TH (tails, then heads) are different outcomes.
- Roll two dice: 6 results for the first die times 6 for the second gives 36 outcomes, shown in the grid below.
Tables like the dice grid and tree diagrams (see Example 3) are the two standard ways to list a sample space without missing anything.
Probability when outcomes are equally likely
The probability that an event happens is written , read "the probability of ." If all outcomes in the sample space are equally likely, then
For one roll of a fair die, the event "even number" has 3 of the 6 outcomes, so .
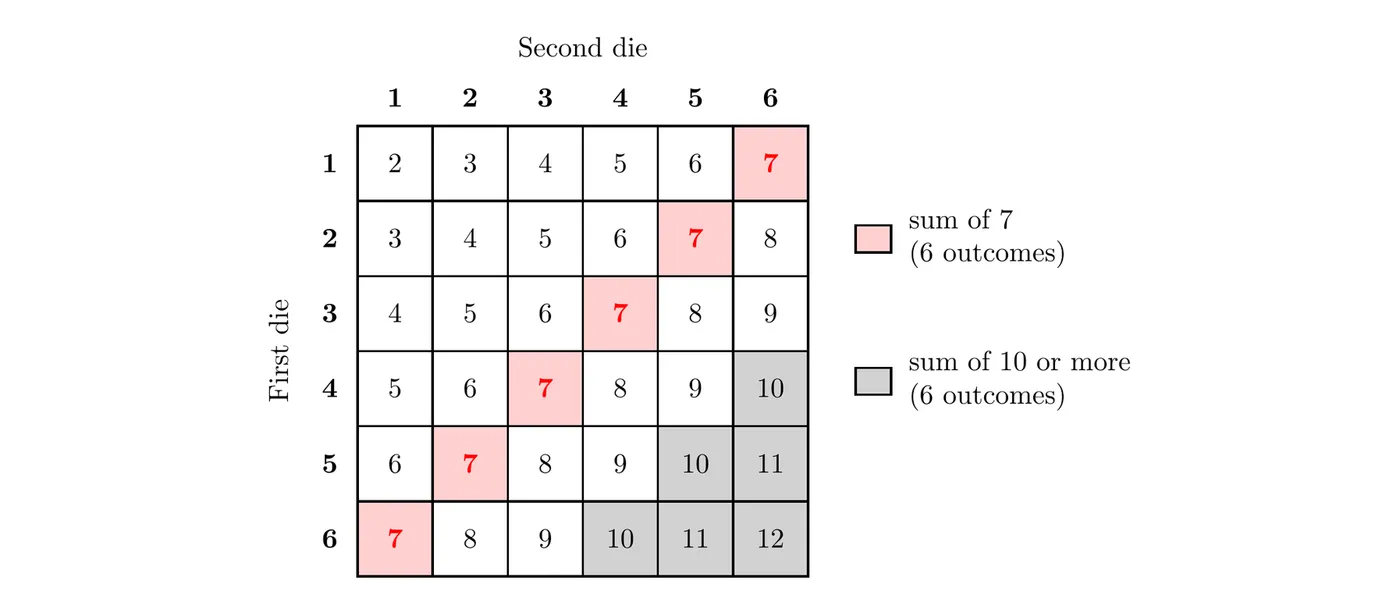
Each cell of the grid is one of the 36 equally likely outcomes for two fair dice, labeled with its sum. To find a probability, count the cells in the event and divide by 36.
The outcomes have to be equally likely
The counting formula only works when every outcome in your list is equally likely. Flip two coins and count heads: the possible numbers of heads are 0, 1, and 2, but they are not equally likely. One head happens two ways (HT and TH), so
The same goes for dice sums. There are 11 possible sums (2 through 12), but a sum of 7 shows up in 6 cells of the grid while a sum of 2 shows up in only 1. Always count from a list of equally likely outcomes, like the 36 cells, not from a list of results.
Probabilities are between 0 and 1
The probability of any event is a number between 0 and 1, inclusive:
- : the event never happens, like rolling a 7 on one die.
- : the event always happens, like rolling a number from 1 to 6.
- The closer is to 1, the more likely the event is. An event with probability 0.5 happens about half the time in the long run.
If a calculation gives a probability below 0 or above 1, there's a mistake somewhere.
Valid probability models
A probability model lists the outcomes of a random process along with their probabilities. Outcomes don't have to be equally likely. A model is valid only if every probability is between 0 and 1 and the probabilities add up to exactly 1 (the probability of the sample space). Because the outcomes don't overlap, the probability of an event is the sum of the probabilities of the outcomes in it.
The complement rule
The complement of an event is the event "not ": every outcome in the sample space that is not in . It can be written , , or . Its probability is
This works because and don't overlap and together they cover the whole sample space, so .
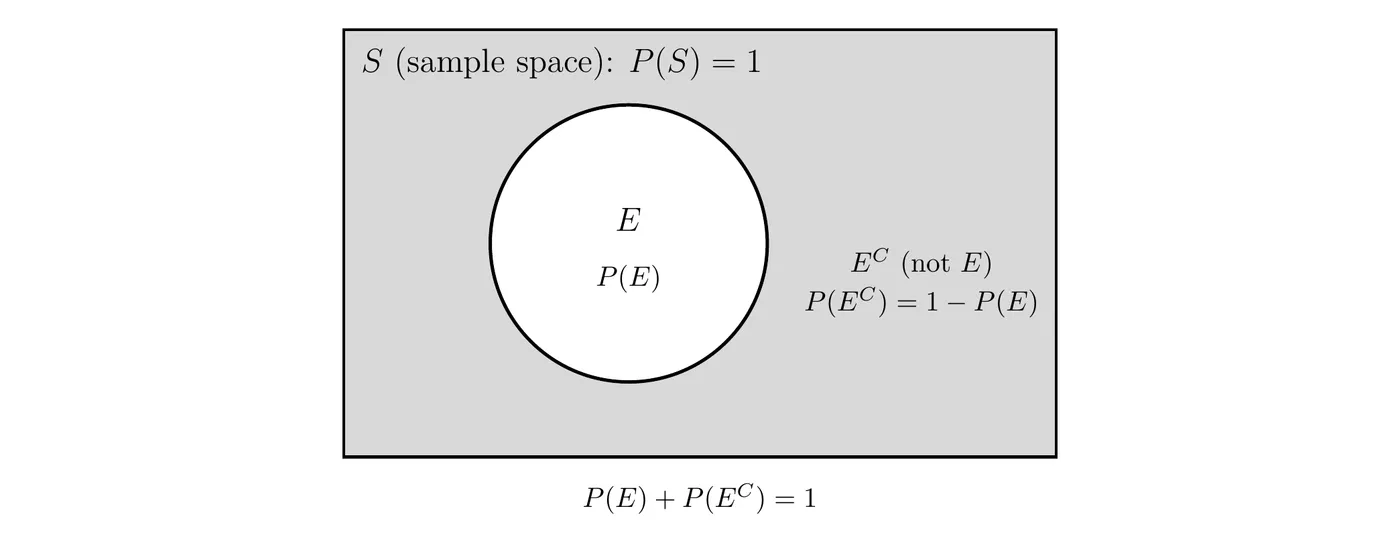
Use the complement when "not " is easier to count than . Phrases like "at least one," "not," and "more than" are clues. For two dice, the sum is at least 3 in every cell except the single cell with sum 2, so
Theoretical and empirical probability
A probability found by counting equally likely outcomes, like the ones on this page, is a theoretical probability. A probability estimated from data or a simulation, like those in Topic 2.3, is an empirical probability. The law of large numbers connects them: as the number of trials grows, the empirical relative frequency gets closer to the theoretical probability.
Example 1: Two dice
Roll two fair six-sided dice. Use the grid to find each probability.
(a)
The sum is 7 in 6 cells: (1, 6), (2, 5), (3, 4), (4, 3), (5, 2), and (6, 1).
(b)
A sum of 10 happens 3 ways, 11 happens 2 ways, and 12 happens 1 way, for outcomes (the gray cells).
(c)
Use the complement of part (a):
There's about an 83.3% chance that the two dice do not add to 7.
Example 2: Getting to school
A school records how its students usually get to school. For a randomly selected student:
Way to school | Bus | Car | Walk | Bike |
Probability | 0.35 | 0.40 | 0.10 | ? |
(a) Find the probability that the student bikes to school.
The probabilities must add to 1:
There's a 0.15 probability that a randomly selected student bikes to school.
(b) Find the probability that the student does not ride the bus.
There's a 0.65 probability that a randomly selected student gets to school some way other than the bus.
(c) For another school, someone proposes the model bus 0.45, car 0.40, walk 0.20, bike 0.05. Explain why this model can't be right.
The probabilities add to . The outcomes don't overlap and cover the whole sample space, so they must add to exactly 1. This model is not valid.
Example 3: Guessing on true-false questions (AP-style)
A student guesses on three true-false questions. Each guess is equally likely to be correct (C) or wrong (W), and the guesses don't affect each other.
(a) List the sample space.
A tree diagram makes sure nothing is missed: two branches for question 1, two more from each of those for question 2, and two more for question 3.
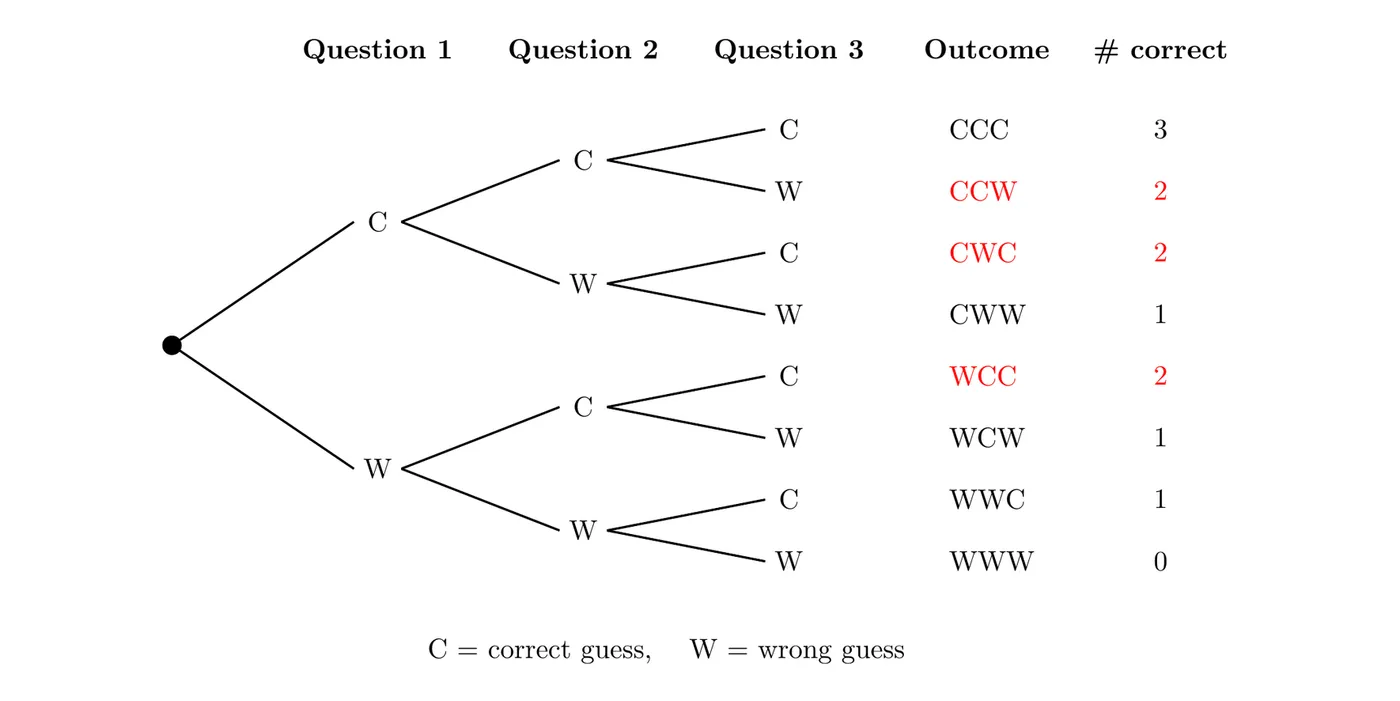
. Since each guess is a 50-50 chance and the guesses don't affect each other, all 8 outcomes are equally likely.
(b) Find the probability that the student gets exactly 2 correct.
Three outcomes have exactly 2 correct: CCW, CWC, and WCC (in red).
There's a 0.375 probability that the student gets exactly 2 of the 3 questions right.
(c) Find the probability that the student gets at least 1 correct.
"At least 1 correct" covers 7 outcomes. Its complement, "none correct," is just WWW, so use the complement rule:
There's a 0.875 probability that the student gets at least one question right.
(d) The student says, "There are four possible scores, 0, 1, 2, or 3, so the chance of getting all 3 right is ." Explain the mistake.
The four scores are not equally likely, so the counting formula can't be applied to them. Only 1 of the 8 equally likely outcomes (CCC) gives 3 correct, so . Scores of 1 and 2 can each happen 3 ways:
Number correct | 0 | 1 | 2 | 3 |
Probability | 1/8 | 3/8 | 3/8 | 1/8 |
This table is a valid probability model: every value is between 0 and 1 and they add to 1. Tables like it come back in Topic 2.8 as probability distributions.
Common mistakes
- Using the counting formula when outcomes aren't equally likely, like treating the sums 2 through 12 (or the scores 0 through 3) as equally likely.
- Treating HT and TH as the same outcome. Order matters when you list a sample space.
- Getting a probability outside 0 to 1 and not noticing that something went wrong.
- Writing the wrong complement. The complement of "at least 2 correct" is "at most 1 correct" (0 or 1), not "at most 2."
- Counting the hard way. For "at least one" questions, is usually much faster.
- Accepting a probability model that doesn't add to 1.