

5.3 - Determining Intervals on Which a Function Is Increasing or Decreasing
Critical Points
A critical point happens when either:
- The derivative equals zero:
- The derivative doesn’t exist
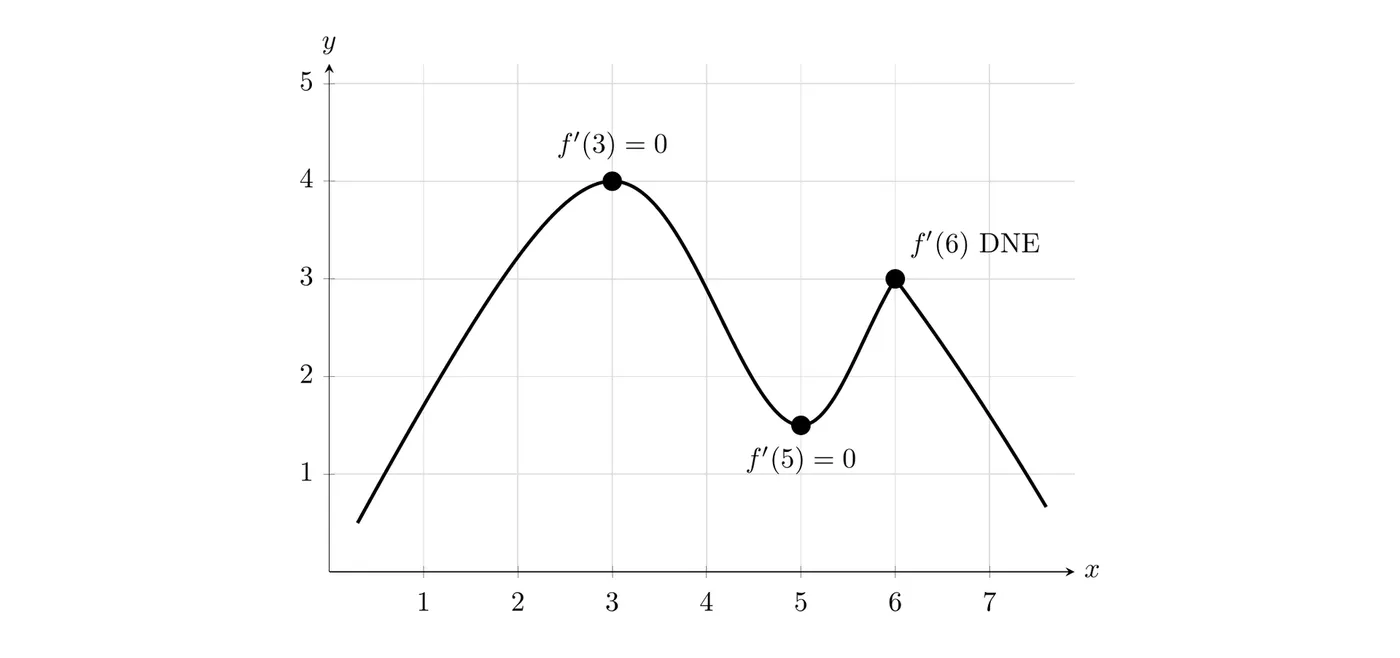
Between critical points, a function is either entirely increasing or entirely decreasing. It can’t switch behavior without passing through a critical point, or through a break in the graph like a vertical asymptote. So any -values where is undefined go in your sign chart too (see 5.4, Example 2).
Sign Analysis Method
- Find the derivative
- Find the critical points by solving and checking where doesn’t exist
- Create intervals using the critical points as boundaries
- Test the sign of in each interval
- Write your conclusions with proper justification
Example 1
Given .
Step 1: Find the derivative.
Step 2: Find critical points.
Step 3: Build a sign chart.
Interval | |||
Sign of |
Step 4: Test the signs.
- For , test :
- For , test :
Step 5: Conclusions.
is increasing on because .
is decreasing on because .
Example 2
Given .
Find the derivative:
Factor:
Critical points: and
Sign chart:
Interval | |||||
Sign of |
The factored form makes sign testing easy:
- :
- :
- :
Conclusions:
is increasing on because .
is decreasing on because .
Reading from the Graph of
When you’re given the graph of the derivative, you can figure out where the original function is increasing or decreasing.
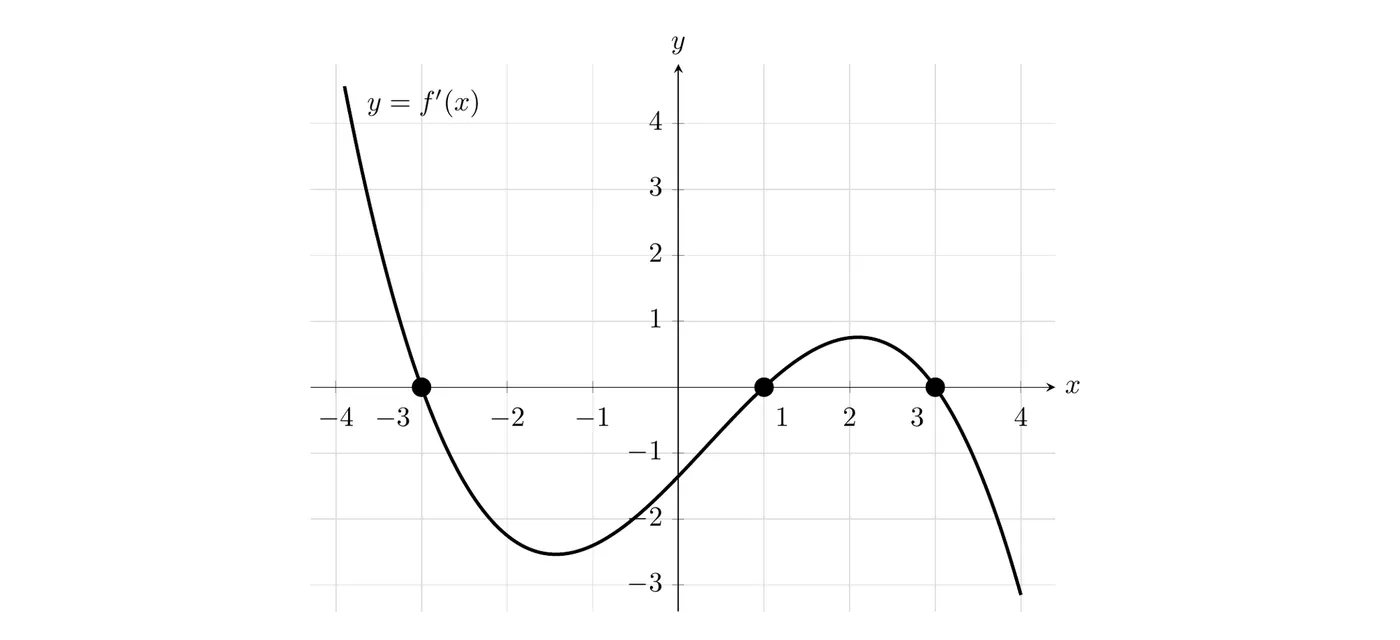
Where (above the x-axis), is increasing: on and .
Where (below the x-axis), is decreasing: on and .
Justification: increases where and decreases where .
Applications: Rates of Change
The sign of a rate of change tells you whether the dependent variable is going up or down.
- If the rate is positive, the quantity is increasing
- If the rate is negative, the quantity is decreasing
Interpretations
Rate | Sign | What it means |
students/year | The number of students is increasing | |
miles/hour | The number of miles is decreasing | |
cases/week | The number of cases is increasing | |
bacteria/(day²) | The rate of bacteria per day is decreasing |
Note: units with squared time (like “per day squared”) represent the rate of change of a rate, similar to a second derivative.
Application Problem
Problem: The rate of change of bacteria in a petri dish at time hours is modeled by
Show that the number of bacteria is decreasing at hours.
Solution: The problem hands you , which is already the rate of change. So to show the bacteria count is decreasing, you just need .
The number of bacteria is decreasing at because .
Common error: Do NOT find . That gives you the rate of change of the rate, which isn’t what the question asked.
Key Question Pattern
When a problem says “the rate of ____ is modeled by ”:
- To show the quantity is increasing or decreasing, check the sign of
- To show the rate is increasing or decreasing, check the sign of
Read carefully and figure out what the given function actually represents.
Key Takeaways
- Critical points happen where or doesn’t exist
- Between critical points (and breaks in the graph), a function is entirely increasing or entirely decreasing
- is increasing where
- is decreasing where
- Use the factored form of the derivative to make sign testing easier
- Given the graph of , just look at where it’s above or below the x-axis
- Always justify: “because ” or “because ”
- For rate problems, figure out whether the given function is the quantity or its rate