

5.5 - Using the Candidates Test to Determine Absolute (Global) Extrema
Candidates for Absolute Extrema
To find the absolute max and absolute min of a function on a closed interval, you only have to check two kinds of points:
- Critical points (where or doesn’t exist)
- Endpoints of the interval
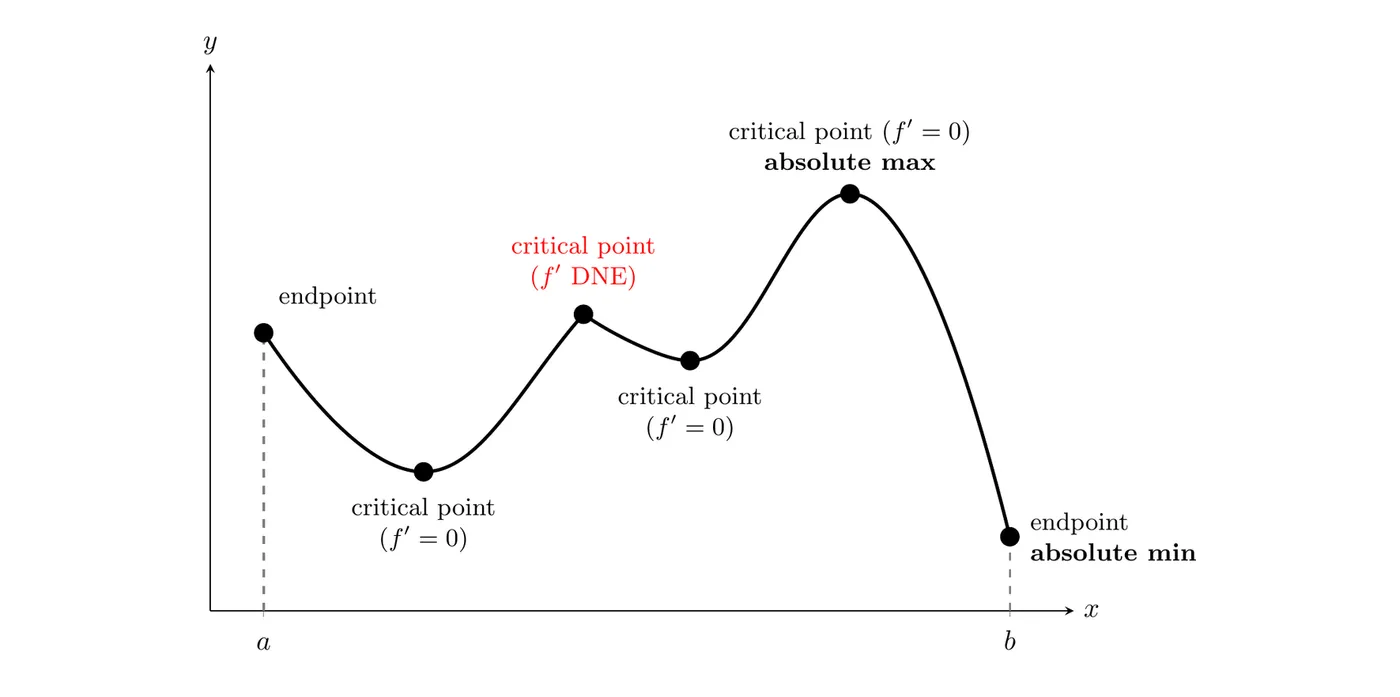
The absolute extrema have to occur at one of these candidates. Nothing else needs to be checked.
Why this works: if is continuous on , the Extreme Value Theorem (5.2) guarantees the absolute max and min exist. An absolute extremum inside the interval is also a relative extremum, so it has to be at a critical point. The only other place it can be is an endpoint.
The Procedure
- Find all critical points by solving and finding where doesn’t exist
- Identify the endpoints of the interval
- Evaluate at every critical point and endpoint
- Compare all the values. Largest is the absolute max, smallest is the absolute min.
Example 1
Find the absolute max and min of on .
Step 1: Critical points.
Both are inside .
Step 2: Endpoints. and
Step 3: Evaluate at all candidates.
Calculation | ||
Step 4: Compare.
Absolute maximum value: , at
Absolute minimum value: , at and
Using the Calculator Table Feature
For ugly expressions, use the table function:
- Enter the function into
- Press
2NDthenTBLSET
- Set “Indpnt: Ask”
- Press
2NDthenTABLE
- Enter each candidate value and record the output
This is really handy for fractions, radicals, or big numbers.
Example 2: Using the Calculator
Find the absolute extrema of on .
Critical points:
Critical points: . But only and are inside .
Candidates:
Absolute maximum value:
Absolute minimum value:
Finding Absolute Extrema from the Graph of
When you’re only given the graph of the derivative, you have to reason about how behaves.
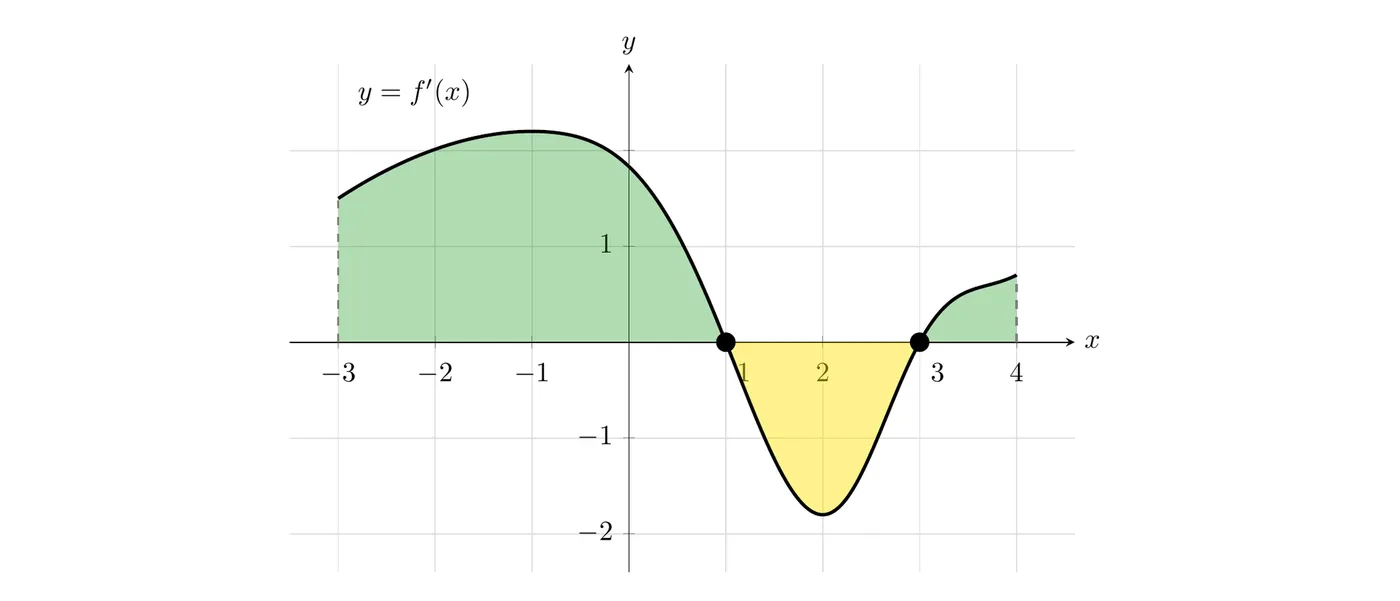
Strategy
Where , is increasing. Where , is decreasing.
To compare candidates, think about the area between and the x-axis:
- Positive area (green) is how much the function goes up
- Negative area (yellow) is how much it goes down
Working Through the Graph
Interval . Candidates: endpoints and , plus critical points and .
For the absolute maximum:
- At : the function increased a lot from to (big green area)
- At : it increased a bit from to (small green area), but it dropped a lot from to (big yellow area)
Since the increase over outweighs the net change over , the absolute maximum is at .
For the absolute minimum:
- At : this is the starting point, before any of the increase
- At : after the big drop from
From to , the function first goes up by the big green area, then down by the smaller yellow area. It ends up higher than where it started, so . So the absolute minimum is at .
Visual Area Comparison
- Large positive area means a significant increase
- Large negative area means a significant decrease
- Compare the net change to figure out which candidate ends up higher or lower
Key Takeaways
- Candidates for absolute extrema are critical points and endpoints, that’s it
- You must evaluate at every candidate
- Absolute max is the largest value among the candidates, absolute min is the smallest
- You don’t need to classify critical points as relative max/min, just evaluate them all
- Show your work by listing every candidate and its function value
- From a graph of , compare areas to figure out net increase and decrease
- The calculator table feature speeds up evaluating messy expressions