

5.8 - Sketching Graphs of Functions and Their Derivatives
The Fundamental Connection
The slope of at any point equals the y-value of at that same x-coordinate.
That relationship is what lets you sketch either graph from the other.
From to : Reading Slopes
- Find critical points where the slope is zero (horizontal tangents)
- Label the slope signs along the curve: positive, negative, or zero
- Estimate slope magnitude: steep sections give large values, flat sections give values near zero
- Plot using those slopes as y-values
Example: Sketching from
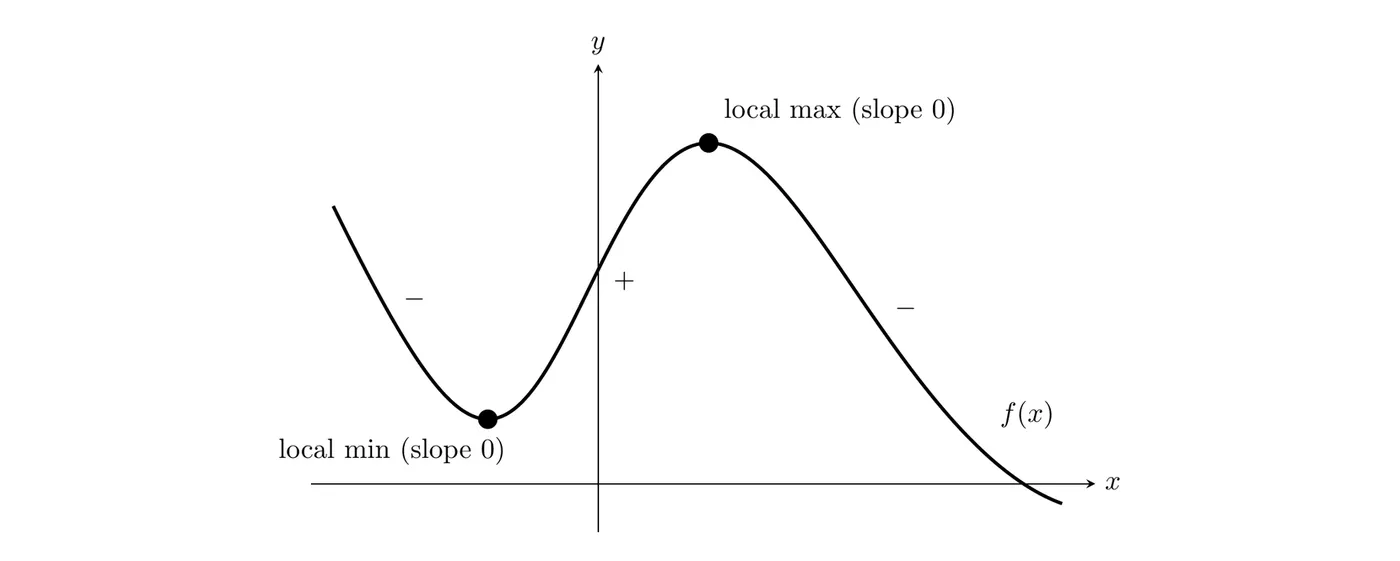
Location | Slope Behavior | Value for |
Left end | Negative, increasing toward zero | Negative, approaching 0 |
Local min | Horizontal tangent | |
Between min and max | Positive, rises then falls | Positive, with a maximum at the inflection point |
Local max | Horizontal tangent | |
Between max and right | Negative, most negative at the inflection point | Negative, with a minimum at the inflection point |
Right end | Negative, increasing toward zero | Negative, approaching 0 |
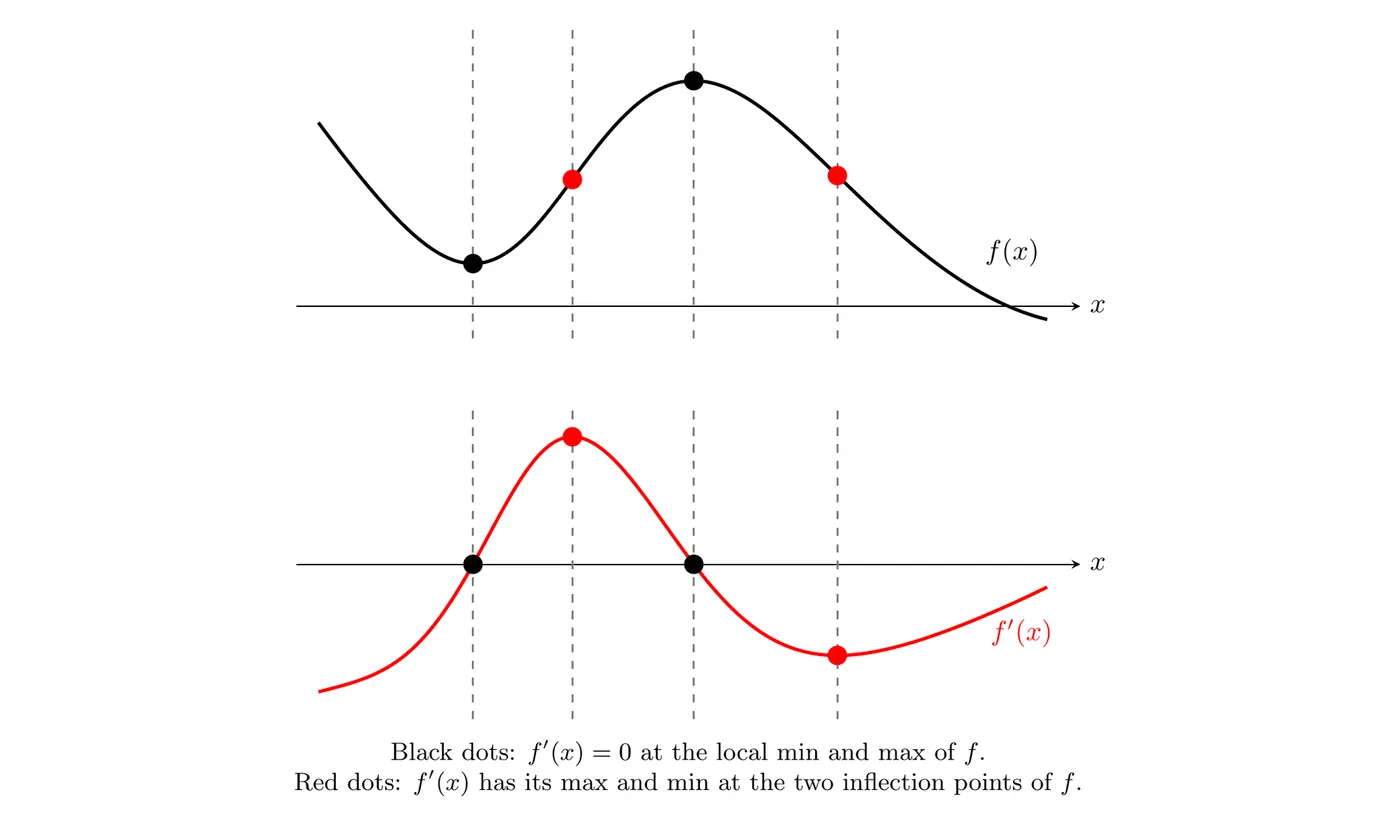
Key observations:
- at the local extrema of
- has extrema at the points of inflection of
- Where is increasing, (above the axis)
- Where is decreasing, (below the axis)
From to : Building the Original Function
When you’re given the graph of , look for:
- Where : these are critical points of
- Sign changes of :
- Negative to positive means a local minimum of
- Positive to negative means a local maximum of
- Where has extrema: these are points of inflection of
- The slope of , which is :
- increasing means means is concave up
- decreasing means means is concave down
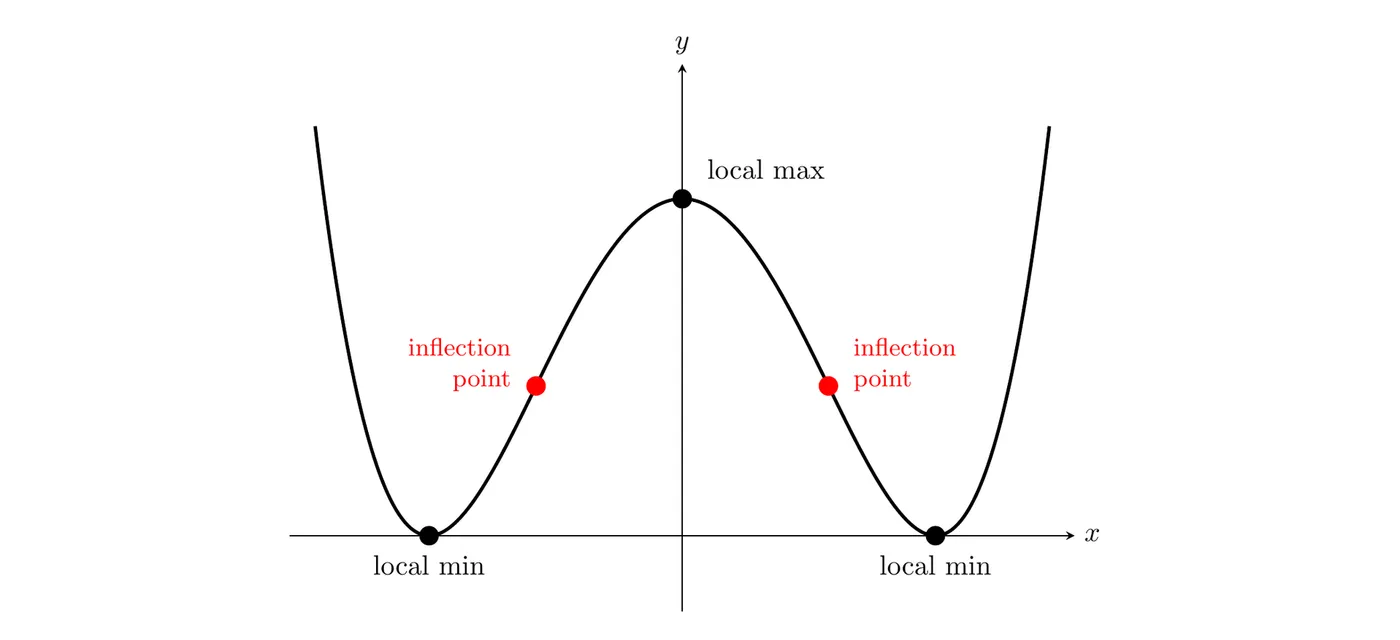
Example: Sketching from
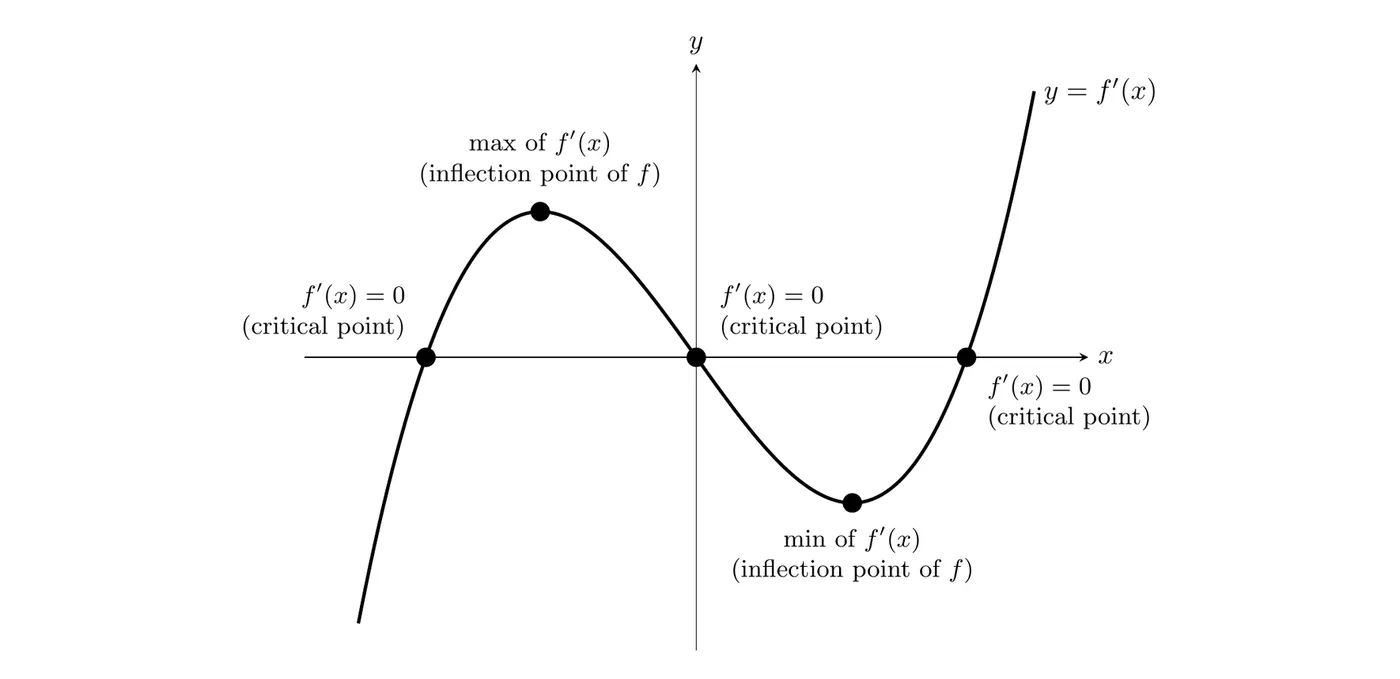
Location on | Feature of | What it means for |
First zero | Changes negative to positive | Local minimum |
Maximum of | , changes + to - | Point of inflection |
Second zero | Changes positive to negative | Local maximum |
Minimum of | , changes - to + | Point of inflection |
Third zero | Changes negative to positive | Local minimum |
Important: The Vertical Shift Problem
When you sketch from , there’s vertical ambiguity.
Both have the same derivative but are shifted 1002 units apart vertically.
So your sketch can slide up or down anywhere. What actually has to be right:
- The x-coordinates of the extrema
- The x-coordinates of the inflection points
- The concavity
- The increasing/decreasing behavior
Any vertical shift is acceptable.
Pattern Recognition Shortcuts
Cubic | Parabola | Linear |
Parabola (like ) | Linear (like ) | Constant (like ) |
Linear | Constant | Zero |
Sine wave | Cosine wave | Negative sine wave |
Example chain:
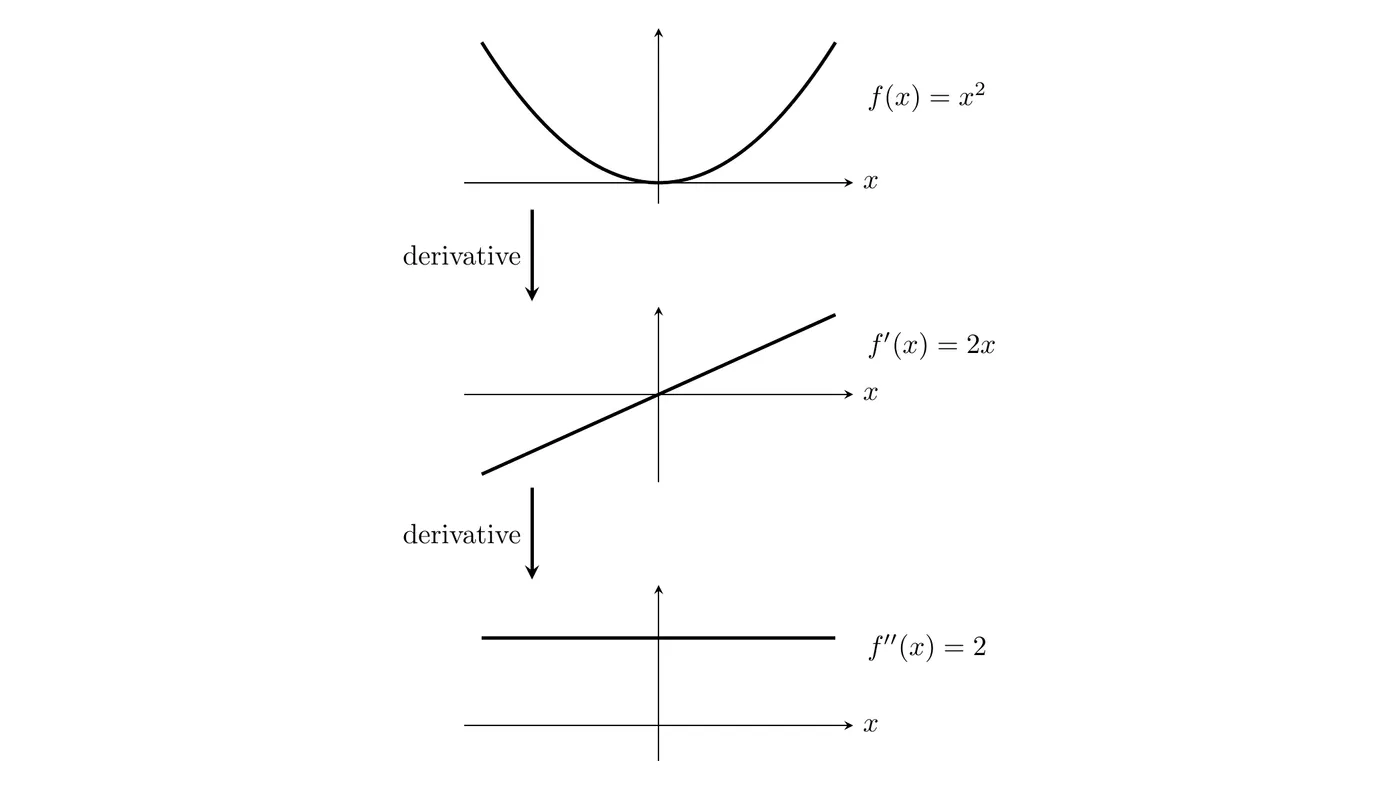
Use with caution: these shortcuts work for standard forms but they won’t help with unusual functions. Always be ready to fall back on analyzing signs and behavior directly.
Complex Example: A Non-Standard Function
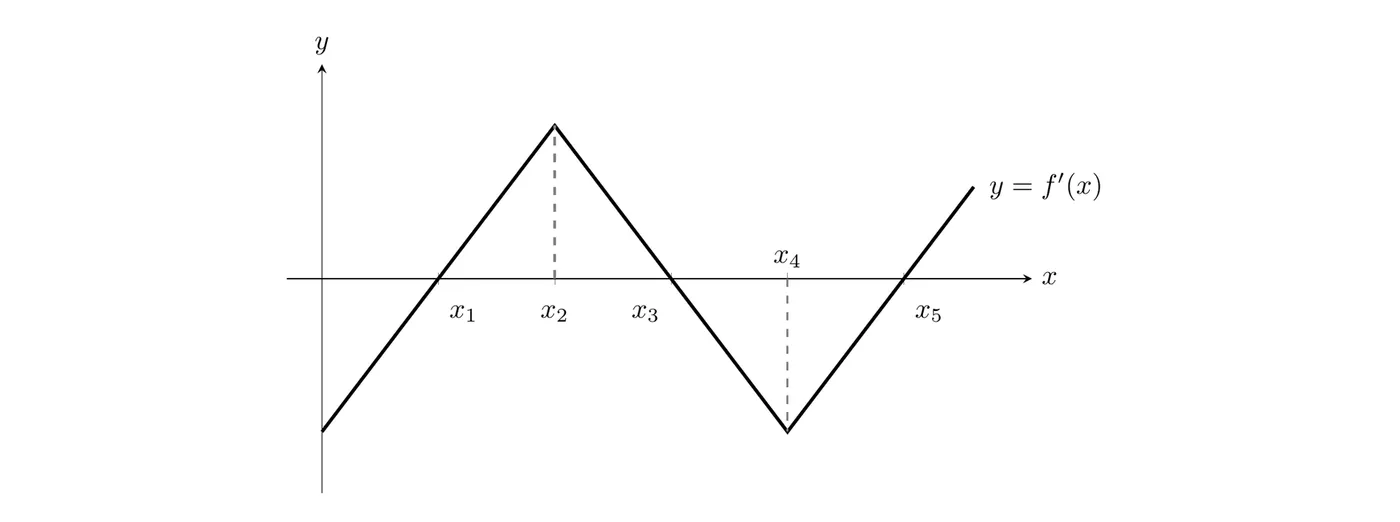
From this , for :
- Local minimum at (sign changes - to +)
- Local maximum at (sign changes + to -)
- Local minimum at (sign changes - to +)
- The cusps of at and are where doesn’t exist, but they can still be inflection points if concavity changes
No memorized pattern helps here, you just have to analyze the behavior directly.
Using a Table of and Values
Sometimes you don’t get a graph at all, just values of and at a few points. You can still describe at those points, as long as you only claim what the table actually shows.
Example: is twice differentiable. The table gives selected values of its derivatives.
0 | 2 | 4 | ||
5 | 0 | 0 | ||
0 | 4 |
- At : , so is increasing there. Also , so is concave down there.
- At : and , so has a relative maximum at by the second derivative test (5.7).
- At : , so is decreasing there. only makes a candidate for a point of inflection. The table doesn’t show what does right next to , so you can’t confirm a sign change from the table alone.
- At : and , so has a relative minimum at .
What a table can’t tell you: what happens between the listed points. Don’t claim whole intervals of increasing, decreasing, or concavity from a table unless the problem gives you more information, like a graph or a formula.
Using a Calculator to Graph Derivatives
TI-84 Method
Given on :
- Press
Y=
- Enter
Y₁ = sin(e^x)
- Move to
Y₂
- Press
MATH, scroll to8:nDeriv(, pressENTER
- Syntax:
nDeriv(Y₁, X, X) - First argument: the function (get it with
VARS→Y-VARS→Function→Y₁) - Second argument: the variable you’re differentiating with respect to (
X) - Third argument: the point to evaluate at (
Xmeans evaluate at every x-value)
- Press
GRAPH
The calculator plots both and at once.
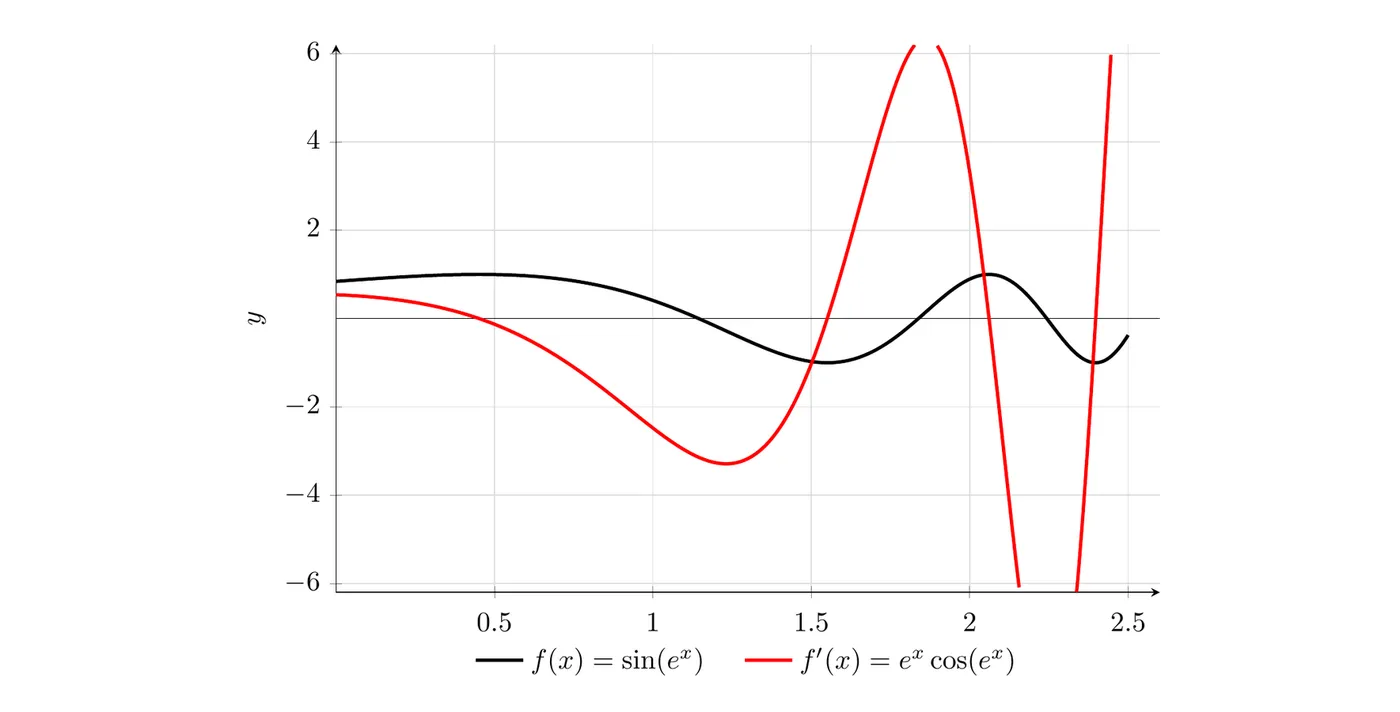
Verification:
- Where has a max or min, (crosses the x-axis)
- Where is increasing,
- Where is decreasing,
Only use calculator methods when the problem allows them.
Key Takeaways
- The slope of equals the y-value of at the same x-coordinate
- From to : read slopes as y-values, and zeros happen at horizontal tangents
- From to : a zero of with a sign change is a local extremum, and extrema of are inflection points of
- Sign changes in : negative to positive is a minimum, positive to negative is a maximum
- Vertical shifts don’t matter when sketching from , any translation is valid
- The x-coordinates of extrema and inflection points DO have to line up correctly
- Pattern recognition (parabola → linear → constant) works only for standard forms
- Concavity from : increasing means concave up, decreasing means concave down
- Calculator shortcut:
nDeriv(function, X, X)graphs the derivative