

5.9 - Connecting a Function, Its First Derivative, and Its Second Derivative
Comprehensive Sign Charts
To fully understand how a function behaves, combine info from both derivatives into organized sign charts.
Building Individual Charts
Example: analyze .
Step 1: Critical points.
Critical points: and
Step 2: Possible inflection points.
Step 3: Individual sign charts.
Chart for :
Interval | |||||
Sign of |
Chart for :
Interval | |||
Sign of |
Step 4: Conclusions.
From the chart:
- Increasing on
- Decreasing on
- Relative maximum at
- Relative minimum at
From the chart:
- Concave down on
- Concave up on
- Point of inflection at
Lining Up the Graphs of , , and
Here are the graphs of , , and from the example above, stacked so the -values line up.
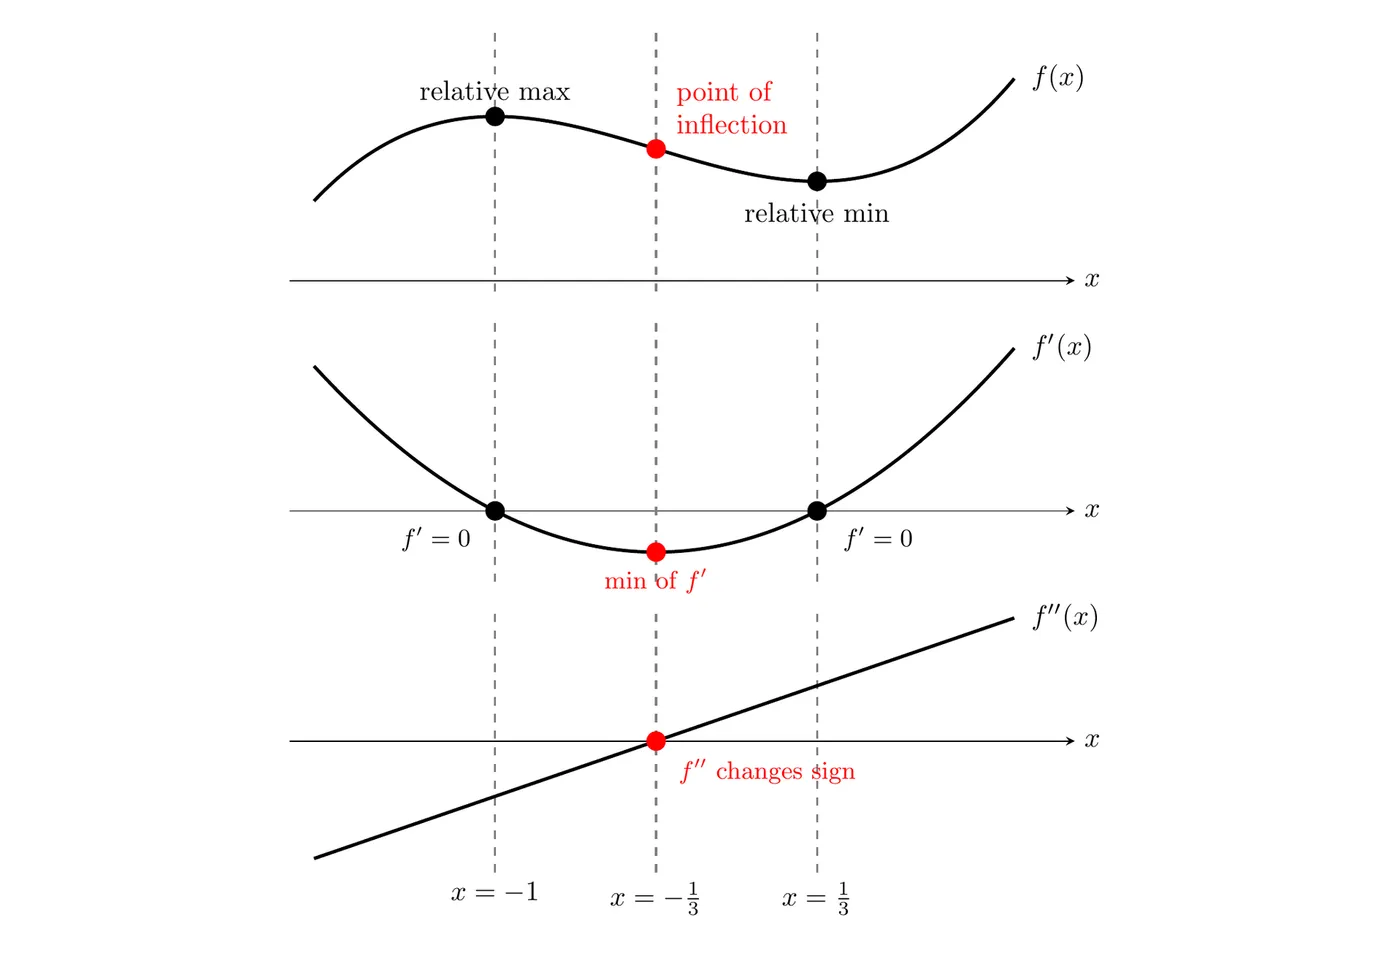
- The relative max and min of (at and ) are exactly where crosses the -axis.
- The point of inflection of (at ) is where has its minimum and where crosses the -axis.
- Where is decreasing, is below the -axis and is concave down. Where is increasing, is above the -axis and is concave up.
Quick reference: the same feature shows up differently on each graph.
On the graph of | On the graph of | On the graph of |
Increasing | Above the -axis | Doesn’t tell you |
Decreasing | Below the -axis | Doesn’t tell you |
Relative maximum | Crosses the -axis from above to below | A negative value there confirms it (5.7) |
Relative minimum | Crosses the -axis from below to above | A positive value there confirms it (5.7) |
Concave up | Increasing | Above the -axis |
Concave down | Decreasing | Below the -axis |
Point of inflection | Relative max or min | Crosses the -axis (changes sign) |
Combined Sign Chart Method
When a question asks about overlapping conditions (like “concave up AND decreasing”), build one comprehensive chart.
- List ALL critical values, from both and
- Make intervals using all of them
- Test the signs of both and in each interval
- Find where the conditions you want overlap
Example: Combined Conditions
Same function, . Critical values: .
Interval | |||||||
Note that only changes sign at and , so it keeps the same sign across the intervals in between. Same idea for , which only changes sign at .
Question: when is both concave up AND decreasing?
- Concave up: on
- Decreasing: on
- Overlap:
Answer: is concave up and decreasing on .
Question: when is both concave down AND increasing?
- Increasing: on
- Concave down: on
- Overlap:
Answer: is concave down and increasing on .
Particle Motion: Speeding Up vs. Slowing Down
For a position function :
- Velocity:
- Acceleration:
Critical point: an object with negative velocity is NOT automatically slowing down. It’s only slowing down if acceleration and velocity point opposite ways.
Example: Particle Motion Analysis
Given position .
Step 1: Velocity and acceleration.
Step 2: Zeros.
at and . at .
Step 3: Combined chart.
Interval | |||||||
Speed | Slowing | Speeding | Slowing | Speeding |
Test points:
- : ,
- : ,
- : ,
- : ,
Step 4: Conclusions.
Speeding up on because and have the same sign.
Slowing down on because and have different signs.
Sign Combinations
Direction | Speed Change | Intuition | ||
Forward | Speeding up | Moving forward, accelerating forward | ||
Backward | Speeding up | Moving backward, accelerating backward | ||
Forward | Slowing down | Moving forward, accelerating backward | ||
Backward | Slowing down | Moving backward, accelerating forward |
Analyzing Functions from Tables of Values
When you only get a table of values for , you can still determine behavior IF you know that and don’t change signs.
Requirements
- doesn’t change sign (always increasing or always decreasing)
- doesn’t change sign (always concave up or always concave down)
Method: Average Rate of Change
1 | 2 | 3 | 4 | |
3 | 5 | 8 | 13 |
Step 1: Increasing or decreasing? Since , it’s increasing.
Step 2: Average rates of change between consecutive points (here ):
Step 3: Analyze the rates. They’re , which are increasing.
Step 4: Conclusion about concavity. The average rates of change approximate values of . Since those rates are increasing, is increasing. And if is increasing, then . So is concave up.
Example 2: A Decreasing Function
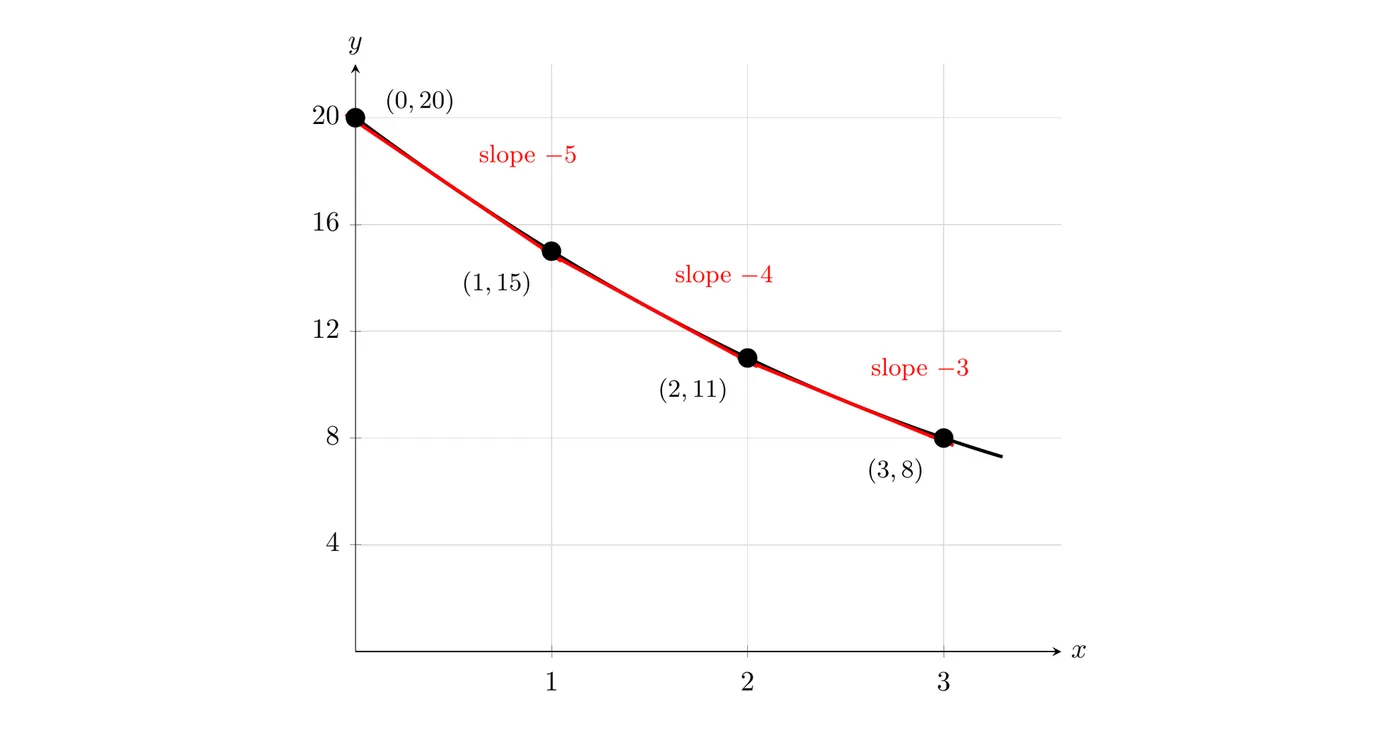
0 | 1 | 2 | 3 | |
20 | 15 | 11 | 8 |
Behavior: decreasing.
Average rates:
- 0 to 1:
- 1 to 2:
- 2 to 3:
The rates are increasing (getting less negative).
Conclusion: since is increasing, , so is concave up.
A decreasing function can absolutely still be concave up, it’s just decreasing more and more slowly.
Important Caveat
This method only works when:
- You know doesn’t change sign on the interval
- You know doesn’t change sign on the interval
- The x-values are evenly spaced (makes the math easier)
Without those guarantees, the function could hide extrema or inflection points between the given points.
Key Takeaways
- Make separate sign charts for and to get the basic behavior
- Use a combined chart with all critical values from both derivatives for overlapping conditions
- For overlapping conditions, find where two properties hold on the same interval
- Speeding up: and have the same sign
- Slowing down: and have opposite signs
- Negative velocity does NOT mean slowing down, you have to check acceleration
- Justify with “because and have the same/different signs”
- From tables, check whether the average rates of change are increasing or decreasing
- Increasing rates mean concave up; decreasing rates mean concave down