

7.2 - Direction of Reversible Reactions
Overview
At any moment, a reversible reaction is running both ways at once. Which way the concentrations actually change depends on which direction is faster. This topic connects the forward and reverse rates to the direction of net change, and shows why a reversible reaction in a closed system always ends up at equilibrium, no matter which side it starts from.
Forward and reverse rates
Use the and system from Topic 7.1:
- The forward rate is how fast molecules break apart into . It depends on how much is present.
- The reverse rate is how fast pairs of molecules combine into . It depends on how much is present.
If each direction is an elementary step, you can write its rate law from the coefficients, just like in Unit 5:
The graphs on this page and in Topic 7.1 were calculated from these two rate laws, so their shapes are exact.
The faster direction sets the net change
Both reactions happen at the same time. What you observe is the net change, the difference between them:
Rates | Net change | What you see for |
Forward faster than reverse | Reactants turn into products | rises, falls, the brown color darkens |
Reverse faster than forward | Products turn back into reactants | falls, rises, the brown color fades |
Forward equal to reverse | No net change: equilibrium | All concentrations constant, the color stays the same |
Notice that the direction depends on which rate is larger, not on which concentration is larger. A mixture can have more product than reactant and still be making more product.
Example 1: Comparing forward and reverse rates
Both directions of this reaction are elementary steps:
The rate constants are and . At one moment, M, M, and M. (a) Calculate the forward and reverse rates. (b) Which way is the net reaction going? (c) How fast is [XY] changing? (d) What happens to the two rates as time goes on?
(a) Write each rate law from the coefficients and plug in:
(b) The forward rate is larger, so there is a net conversion of X and Y into XY.
(c) The net rate is the difference:
So [XY] is increasing by about M/s, and [X] and [Y] are each decreasing by M/s (2 significant figures, because the subtraction leaves the ten-thousandths place).
(d) As X and Y are used up, the forward rate drops. As XY builds up, the reverse rate rises. The rates keep getting closer until they are equal, and then the system is at equilibrium. (In Topic 7.10 you'll reach the same conclusion by comparing Q with K.)
Why the rates always meet
The two rates push each other toward equality. Suppose the forward reaction is faster. Then reactants are being used up, so the forward rate slows down. At the same time, products are building up, so the reverse rate speeds up. The gap between the rates shrinks until the rates are equal. The same thing happens the other way if the reverse reaction starts out faster.
Once the rates are equal, nothing drives any further change, so the system stays at equilibrium. It doesn't overshoot.
Approaching equilibrium from either side
The graphs below show two flasks at the same temperature. The left one starts with only M , so at first the reverse rate is zero and the forward reaction wins. The right one starts with only M , so at first the forward rate is zero and the reverse reaction wins.
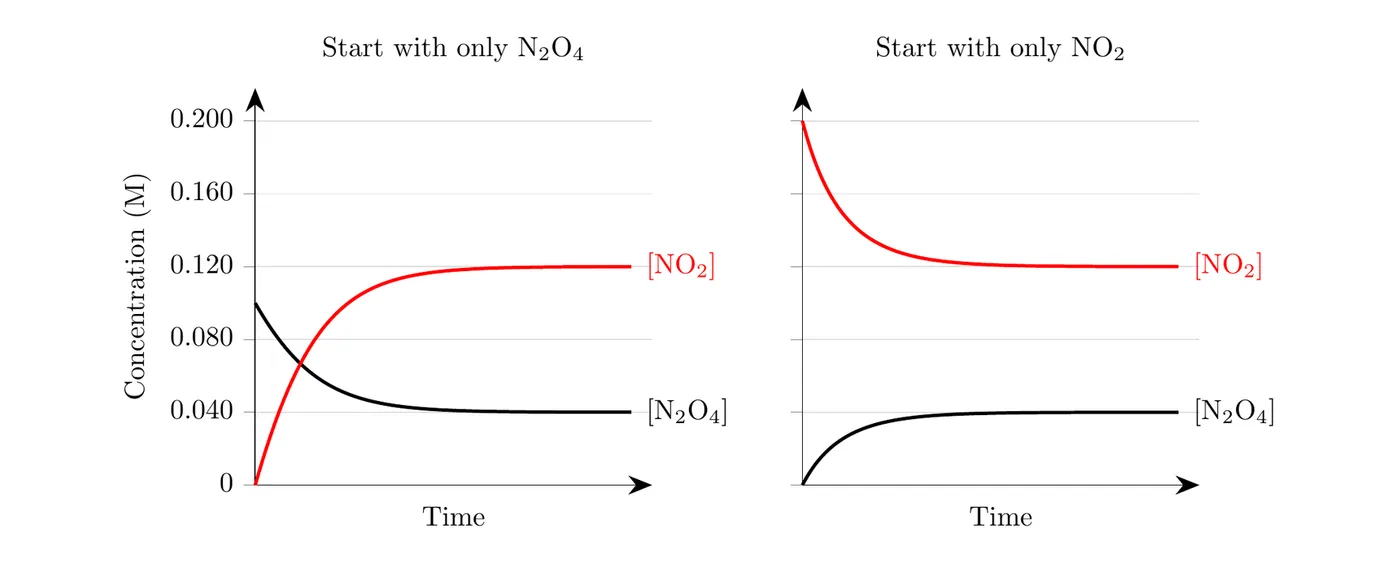
Both flasks end at the same place: M and M . That's because they hold the same atoms in the same volume: M of is exactly what you get if all M of breaks apart. Equilibrium can be reached from either direction.
Example 2: Reading a rate graph (AP-style)
A sealed flask at constant temperature starts with only . The graph shows the rates of the forward reaction () and the reverse reaction () over time.
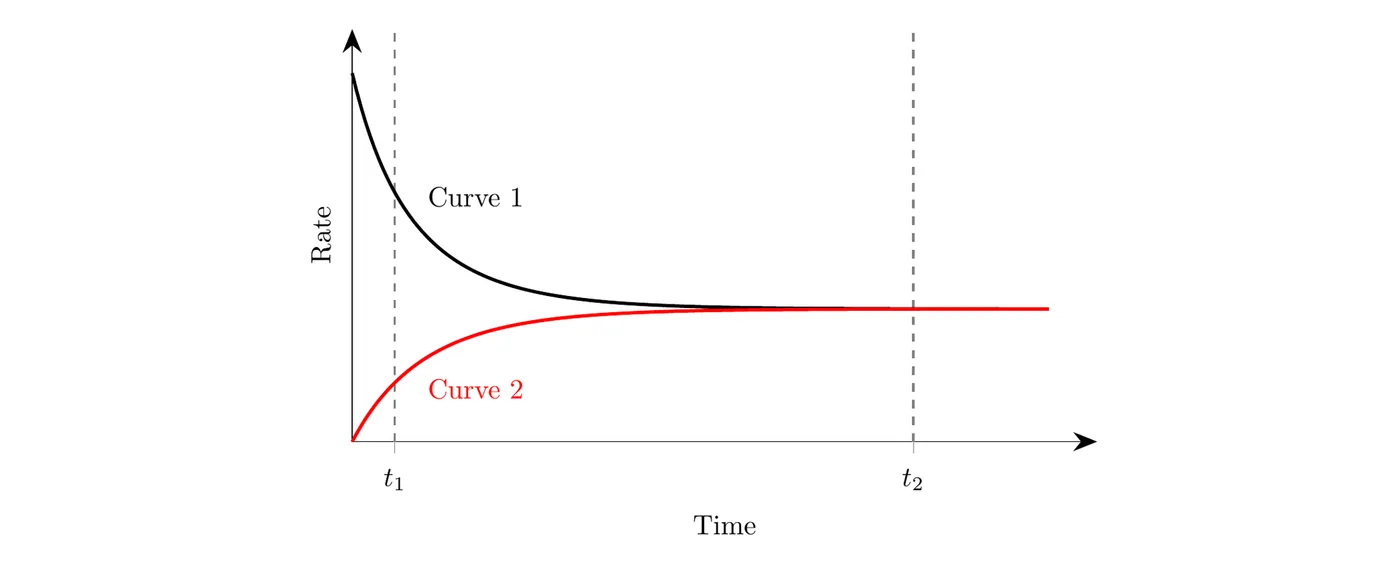
(a) Which curve shows the forward rate? Justify your answer. (b) At time , is the brown color getting darker, getting lighter, or staying the same? Justify your answer. (c) Describe the rates and the concentrations at time .
(a) Curve 2. At the start there is no in the flask, so the forward reaction (which uses ) must start at a rate of zero. Curve 1 starts high because the flask is full of , which feeds the reverse reaction.
(b) Lighter. At , Curve 1 (reverse) is above Curve 2 (forward), so is being used up faster than it forms. There is a net conversion of brown into colorless , so the color fades.
(c) At the two rates are equal, so the system is at equilibrium. The concentrations of and are constant (but not equal to each other), and the color stays the same. Both reactions are still happening.
From particles to what you see
Particle diagrams connect what the molecules are doing to what you can see, but only up to a point. For reaction direction, keep these in mind:
- A particle diagram is a snapshot. It shows how many of each particle are present at one instant. It can't show rates, so a single diagram can't tell you which way the reaction is going.
- Two snapshots show the net direction. If the number of product particles grew between two snapshots, the forward reaction was faster during that time.
- Equilibrium shows up as unchanging counts. At equilibrium, later snapshots have the same counts, even though individual molecules keep reacting.
- The particle counts connect to observations. is brown and is colorless, so more particles means a darker color. A color change tells you the net direction.
- Diagrams are scaled down. A real flask holds trillions of trillions of molecules, not 17. The ratios in a diagram matter, not the exact numbers.
Example 3: Two particle snapshots (AP-style)
The diagrams show the same sealed flask of and at two times, at constant temperature.
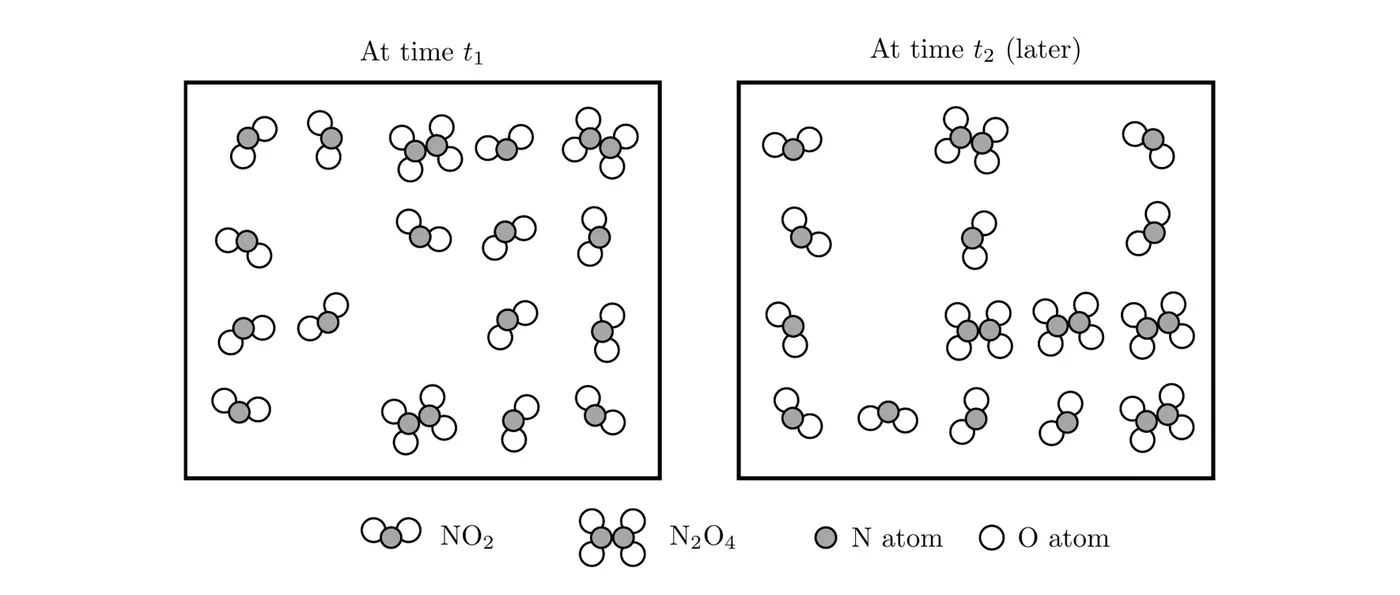
(a) Show that the diagrams conserve atoms. (b) Between and , was the forward or the reverse reaction faster? Justify your answer. (c) What would you observe about the color? (d) A student says the system is at equilibrium at . Can you tell from these diagrams?
(a) At : 3 and 14 give N atoms and O atoms. At : 5 and 10 give N atoms and O atoms. Same atoms, just rearranged.
(b) The reverse reaction. The number of went from 3 to 5 and the number of went from 14 to 10: a net 4 combined into 2 . So happened more often than the forward reaction.
(c) Fewer molecules means the brown color got lighter.
(d) No. A single snapshot shows counts, not rates. To support the claim, you'd need more snapshots after that all show 5 and 10 .
Common mistakes
- Saying a reaction "only goes forward" before equilibrium. Both directions happen. The faster one sets the net direction.
- Judging direction by which concentration is bigger. Look at which rate is bigger, or which way the concentrations are changing.
- Drawing rate curves that cross. In a closed system with no disturbance, the rates approach each other and become equal. They don't pass each other.
- Assuming the forward rate always starts high. The rate that starts at zero is the one with nothing to react, so it depends on what the flask starts with.
- Claiming equilibrium from one particle diagram. You need to see that the counts stay constant over time.