

7.8 - Representations of Equilibrium
Overview
Equilibrium can be shown with numbers, graphs, or pictures. A particulate diagram, a box of drawn molecules, shows how many reactant and product particles are present before a reaction and at equilibrium, and you can read K straight from it. The AP exam asks you to interpret these diagrams, pick the one that matches a K value, and draw your own, so it pays to be fluent in moving between particles, graphs, and the K expression.
What a particle diagram shows
- Each symbol is one particle, or a fixed amount of particles. The key tells you which atoms are which.
- Counts are relative amounts. If you know the volume, or the problem says how much each particle represents, counts turn into concentrations or pressures.
- Atoms are conserved. Every box in one experiment must contain the same number of each kind of atom, no matter how the atoms are combined.
- A diagram is a snapshot. At equilibrium, molecules keep reacting in both directions at equal rates. A snapshot taken later shows the same number of each kind of particle, but not the same individual molecules.
Reading snapshots: when is equilibrium reached?
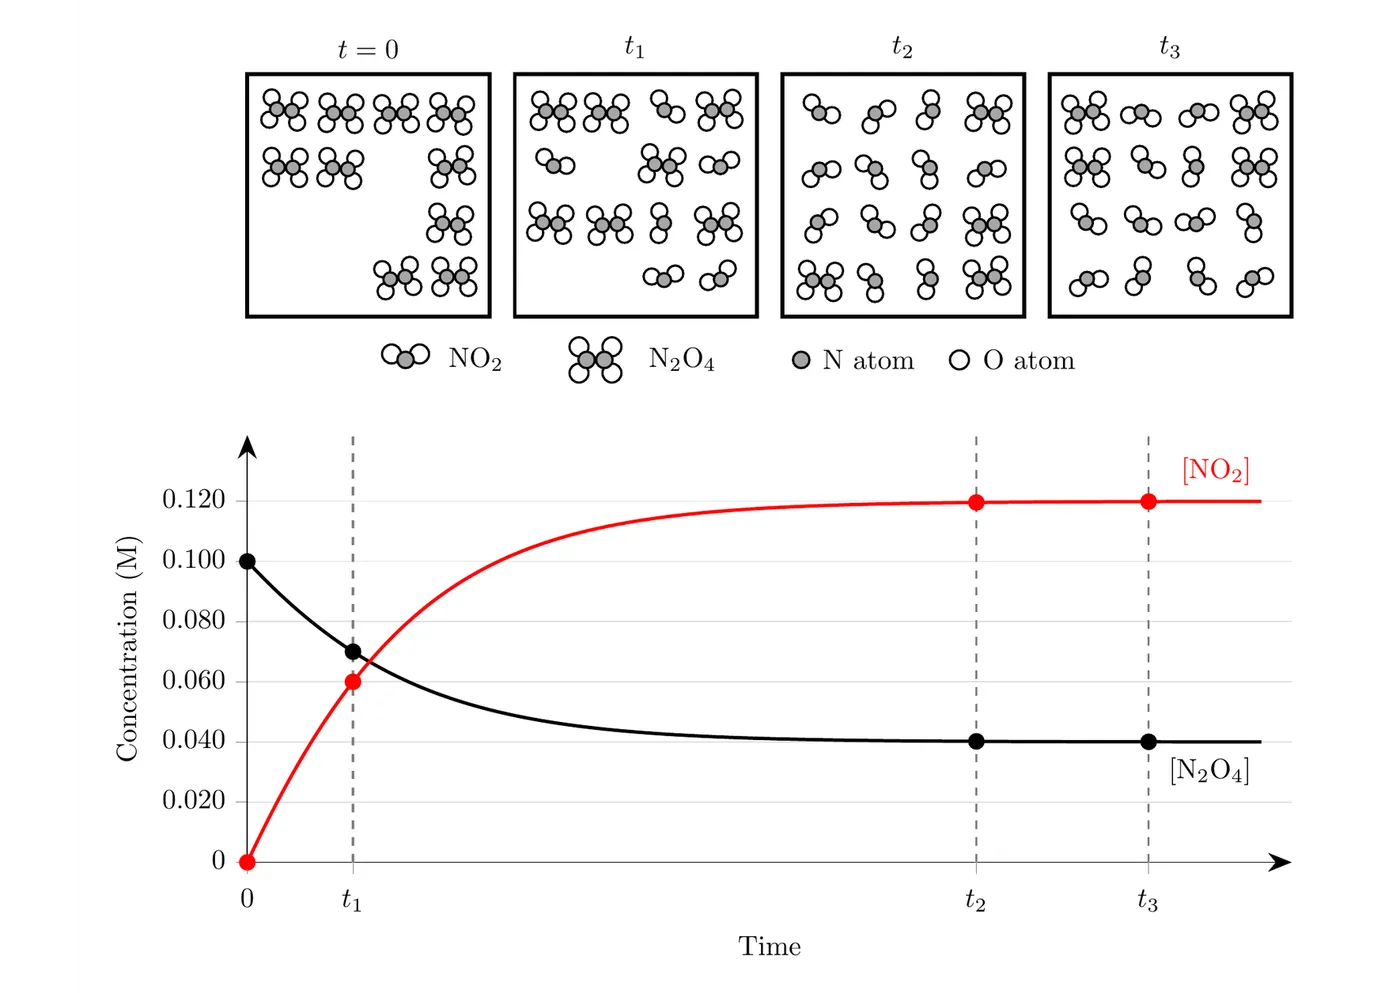
The diagrams follow a sealed container of as it reaches equilibrium at constant temperature:
This is the same system as Topics 7.1 to 7.4, starting from 0.100 M . Each molecule represents 0.0100 M. The graph shows the same experiment as concentration vs. time, with dots at the times of the snapshots.
Example 1: Reading a series of snapshots
Time | molecules | molecules | (M) | (M) |
0 | 10 | 0 | 0.100 | 0 |
7 | 6 | 0.0700 | 0.0600 | |
4 | 12 | 0.0400 | 0.120 | |
4 | 12 | 0.0400 | 0.120 |
(a) When is equilibrium reached? The counts change from 0 to and from to , but not from to . The system has reached equilibrium by , and the graph agrees: both curves are flat from there on. Equilibrium doesn't mean equal amounts. At equilibrium there are 3 times as many molecules as molecules.
(b) Are atoms conserved? Count N atoms in each box: at the start, at , and at and . Every box has 20 N atoms (and 40 O atoms), as it must.
(c) Calculate . Use the equilibrium box:
(d) Was the system at equilibrium at ?
No. , so the net reaction was still running forward at , which is why more shows up by .
Watch the scale. Plugging raw counts into the expression gives , which is 100 times too big. This reaction has 1 particle on the left and 2 on the right, so the conversion from counts to concentration doesn't cancel. Convert counts to concentrations first. Raw counts work only when both sides of the equation have the same total number of particles, as in the next example.
Using K to pick or draw the equilibrium mixture
To decide whether a diagram shows equilibrium:
- Check that atoms are conserved compared with the starting box. A box that gains or loses atoms can't be right.
- Count the particles and calculate Q. Convert counts to concentrations first, unless both sides of the equation have the same total number of particles.
- If , the box shows equilibrium. If , the reaction still has to run forward; if , it has to run in reverse.
To draw an equilibrium box, run the same steps backward: use an ICE table with particle counts, find the counts that make , then draw exactly that many of each particle.
Example 2: Which box shows equilibrium? (AP-style)
For the reaction
at a certain temperature. A container starts with 6 and 6 molecules. Which box shows the mixture at equilibrium?
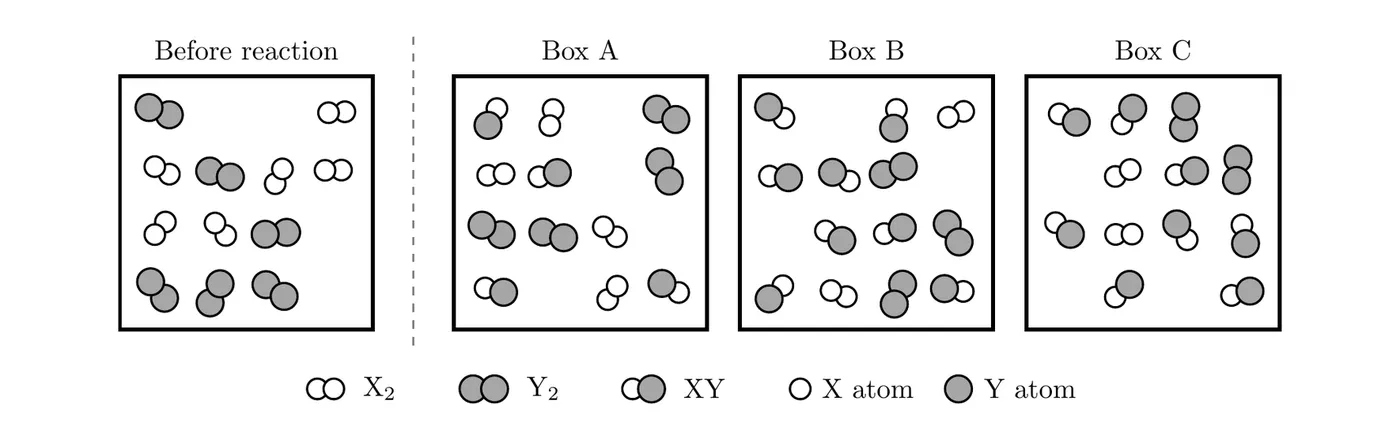
There are 2 particles on each side of the equation, so the volume cancels and counts can go straight into the K expression:
Box | XY | X atoms | Y atoms | Q | ||
Start | 6 | 6 | 0 | 12 | 12 | 0 |
A | 4 | 4 | 4 | 12 | 12 | |
B | 2 | 3 | 8 | 12 | 14 | Not possible |
C | 2 | 2 | 8 | 12 | 12 |
- Box A conserves atoms, but . This mixture is on its way to equilibrium; the net reaction still runs forward.
- Box B can't happen. It has 14 Y atoms, but the container started with 12, so its Q value doesn't matter.
- Box C conserves atoms and has . Box C shows equilibrium.
It also makes sense: is greater than 1, so products are favored and most of the atoms end up in XY. But K isn't huge, so a few and molecules remain. A box with 12 XY and no reactants at all would be wrong.
Example 3: Connecting particles to color
is colorless and is reddish brown, so the color of the gas shows how much is present. Two sealed tubes hold identical samples. Tube A sits in an ice bath and is pale brown. Tube B sits in hot water and is dark brown. Each molecule in the boxes represents 0.0100 M.
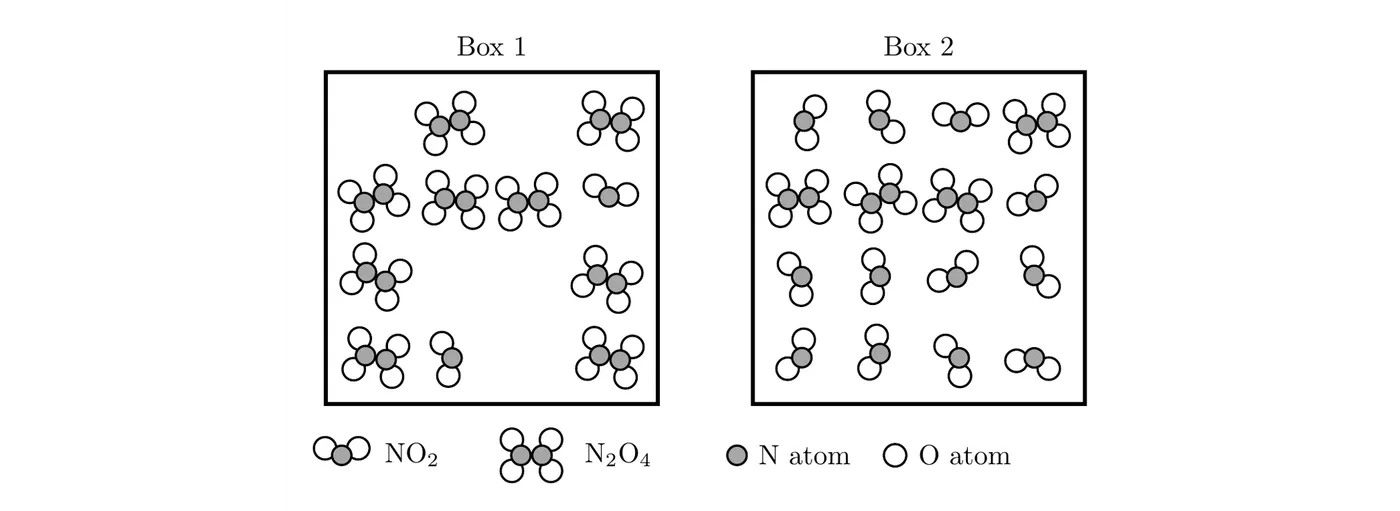
(a) Match each box to a tube. Box 2 has 12 molecules and Box 1 has only 2. More means a darker color, so Box 2 is the hot tube (B) and Box 1 is the cold tube (A). Both boxes have 20 N atoms, as identical samples should.
(b) Calculate for each tube.
(c) What does the comparison tell you? K is about 80 times larger in the hot tube. The same reaction has a different K at a different temperature. Topic 7.10 explains why temperature is the one stress that changes K itself. Here, heating favors the forward reaction, which breaks the bond between the two N atoms and absorbs energy. (Box 2 matches the equilibrium in Example 1, so that experiment ran at the hot tube's temperature.)
Four ways to show the same equilibrium
Representation | What it shows | How to get K from it |
Balanced equation and K expression | Which species react, and in what ratio | K is given or calculated |
ICE table | Starting amounts, changes, and equilibrium amounts | Substitute the Equilibrium row into the K expression |
Graph of concentration vs. time | How the system approaches equilibrium; flat lines mean equilibrium | Read the flat (equilibrium) values and substitute |
Particle diagram | Relative numbers of particles before and at equilibrium | Count, convert to concentrations, and substitute |
The exam may ask you to move from one representation to another: draw the particle diagram that matches an ICE table, or sketch the graph that goes with a series of snapshots. The numbers have to agree across all of them, the way the boxes and the graph agree in Example 1.
Common mistakes
- Thinking equilibrium means equal numbers of reactant and product particles. It means the numbers stop changing.
- Plugging raw counts into K when the two sides of the equation have different numbers of particles. Convert to concentrations first.
- Drawing an equilibrium box with no reactants left. Unless K is huge, a visible number of reactant particles remains.
- Not conserving atoms between the starting box and the equilibrium box.
- Treating a snapshot as frozen. At equilibrium, particles keep reacting in both directions at equal rates.