

7.4 - Calculating the Equilibrium Constant
Overview
You can't work out K from the balanced equation alone. It has to be measured: let the reaction reach equilibrium, measure the concentrations or partial pressures, and plug them into the K expression. This topic shows how to do that cleanly, including the common case where you measure only one species and an ICE table fills in the rest.
K comes from measurements at equilibrium
To calculate K from experimental data:
- Write the balanced equation, with phases.
- Write the K expression: if you have molarities, if you have partial pressures (Topic 7.3).
- Find the equilibrium value of every species in the expression, either measured directly or from an ICE table.
- Plug in and calculate. Report K without units, with significant figures set by the data.
In the lab, equilibrium amounts are usually measured in one of these ways:
- Color: the absorbance of a colored species gives its concentration through Beer's law, (Topic 3.13).
- Pressure: a gauge gives the total pressure, and Dalton's law, , gives partial pressures.
- pH: a pH meter gives the hydronium ion concentration (Unit 8).
Two things matter for every measurement: take it at equilibrium (when the readings have stopped changing) and at constant temperature, because K changes with temperature.
Example 1: Kc from equilibrium concentrations
At a certain temperature, an equilibrium mixture of , , and has M, M, and M. Calculate .
Answer: (3 significant figures, like the data).
The same K from different starting mixtures
The table shows four flasks of and at the same temperature, each started with a different mixture and left to reach equilibrium.
Run | Starting (M) | Starting (M) | Equilibrium (M) | Equilibrium (M) | ||
1 | 0.100 | 0 | 0.0400 | 0.120 | 3.00 | 0.360 |
2 | 0.200 | 0 | 0.103 | 0.193 | 1.87 | 0.362 |
3 | 0.0200 | 0 | 0.00315 | 0.0337 | 10.7 | 0.361 |
4 | 0.0500 | 0.0500 | 0.0263 | 0.0973 | 3.70 | 0.360 |
The equilibrium concentrations depend on where each flask started, and so does the simple ratio . But comes out the same every time, about 0.360 (the small differences come from rounding the measurements to 3 significant figures). This is the experimental evidence for the law of mass action, and it's why K is so useful: one number describes every equilibrium mixture of this reaction at this temperature.
ICE tables: when you measure only one species
Often you know the starting amounts and measure just one species at equilibrium. An ICE table fills in the rest:
- I (initial): the starting concentrations (or partial pressures).
- C (change): how much each one changes, written with one unknown, , times the coefficient. Reactants get times their coefficient and products get times theirs (if the reaction runs forward).
- E (equilibrium): initial plus change.
Set the E entry for the measured species equal to its measured value, solve for , and fill in everything else. Some tips:
- Work in molarity for (divide moles by the volume first) or in atm for .
- When solutions are mixed, find each concentration after mixing first: the total volume changed.
- Solids and pure liquids don't need rows, since they're not in K.
- Keep an extra digit in the middle steps and round only at the end.
Example 2: Kp from a pressure measurement (AP-style)
A rigid, evacuated flask is filled with gas to a pressure of atm and held at a constant temperature, where it partly decomposes:
At equilibrium, the total pressure is atm. Calculate .
Step 1: Set up an ICE table in atm. In a rigid flask at constant temperature, pressure is proportional to moles, so pressures can go straight into the table.
Initial (atm) | 0.820 | 0 | 0 |
Change (atm) | |||
Equilibrium (atm) |
Step 2: Use the total pressure to find . Add the equilibrium pressures:
So atm and atm.
Step 3: Plug into .
Answer: .
Example 3: An ICE table from one measured concentration (AP-style)
A student places 0.3000 mol of and 0.2000 mol of in an evacuated 20.00 L flask at 430 °C. At equilibrium, the violet color shows M. (These are the data from Topic 7.1, Example 2.) Calculate .
Step 1: Starting concentrations.
Step 2: ICE table. Each used makes two HI, so HI changes by .
Initial (M) | 0.01500 | 0.01000 | 0 |
Change (M) | |||
Equilibrium (M) |
Step 3: Solve for with the measured value.
So M and M (one extra digit kept for now).
Step 4: Plug into .
Answer: at 430 °C, to 3 significant figures (set by the measured ).
How each measurement affects K
Because each concentration is raised to its coefficient, some measurements affect K more than others. Take
- If were twice as large (everything else the same), would be times larger.
- If were twice as large, would be times smaller.
- If were twice as large, would be half as large.
In the lab, this means an error in a species with a big coefficient matters more. Measuring 10% too high makes about 21% too high, since .
Example 4: Measuring K with a spectrophotometer (AP-style)
A common AP lab measures K for the formation of the blood-red ion :
First the student makes standard solutions with a large excess of , so nearly all the turns into and each standard's is known. Their absorbances, measured in a 1.00 cm cuvette, give the calibration line below. Then the student mixes 5.00 mL of M with 5.00 mL of M KSCN. At equilibrium, the mixture's absorbance is .
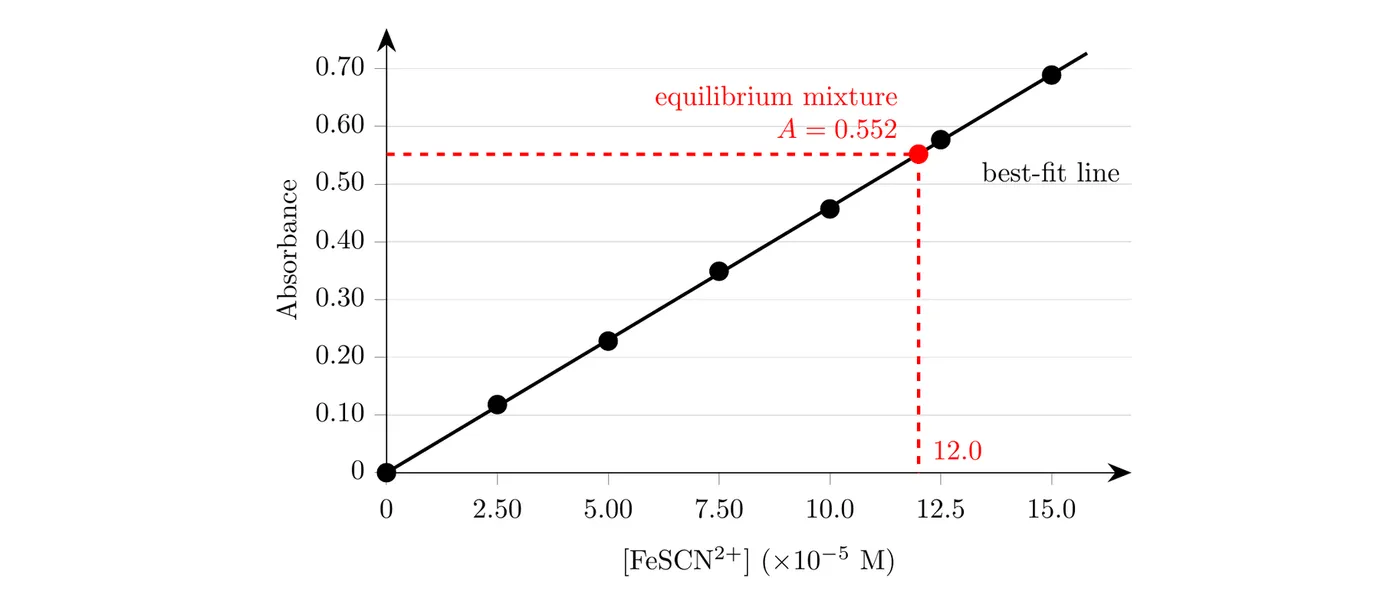
The best-fit line is . (a) Find at equilibrium. (b) Find the starting concentrations of and after mixing. (c) Calculate . (d) The cuvette had fingerprints on it, which made the measured absorbance too high. Is the calculated too high or too low? Justify your answer.
(a) Read the line, or solve its equation:
(b) Mixing doubles the volume, so each concentration is cut in half:
(c) ICE table, with M from part (a):
Initial (M) | 0 | ||
Change (M) | |||
Equilibrium (M) |
(d) Too high. A high absorbance gives a that is too high, which makes the numerator too big. It also makes the calculated equilibrium and too small (more was subtracted in the ICE table), which makes the denominator too small. Both effects push up.
Common mistakes
- Plugging starting values into K. K needs equilibrium values. Use an ICE table to get them.
- Using moles instead of molarity. Divide by the volume (in liters) before using .
- Forgetting dilution when solutions are mixed. In Example 4, using M instead of M would give instead of 155.
- Ignoring coefficients in the change row. If the coefficient is 2, the change is .
- Using concentrations for (or pressures for ). Match the data to the K.
- Rounding too early or giving K units. Keep a guard digit, round at the end, and report K without units.