

3.6 - Deviation from Ideal Gas Law
Overview
The ideal gas law, , is a model. It works well for most gases near room temperature and normal pressures, but no real gas follows it perfectly. This topic is about when real gases break the model and why, explained at the particle level. On the AP exam you'll be asked to predict whether a real gas has a higher or lower pressure (or volume) than the ideal gas law predicts and to justify your answer with interparticle forces or particle volume.
What the ideal gas model assumes
From Topic 3.5, kinetic molecular theory pictures an ideal gas this way:
- The particles have no volume. Each particle is treated as a point, so all of the container's volume is empty space the particles can move through.
- The particles don't attract or repel each other. They only interact when they collide.
- Collisions are elastic. No kinetic energy is lost when particles hit each other or the walls.
For a real gas, the first two assumptions are never exactly true. Real molecules take up space, and they attract each other through the intermolecular forces from Topic 3.1 (London dispersion forces, dipole-dipole forces, and hydrogen bonds). Most of the time these effects are tiny because the particles are far apart and moving fast. They become noticeable in two situations, and each one pushes the gas in a different direction.
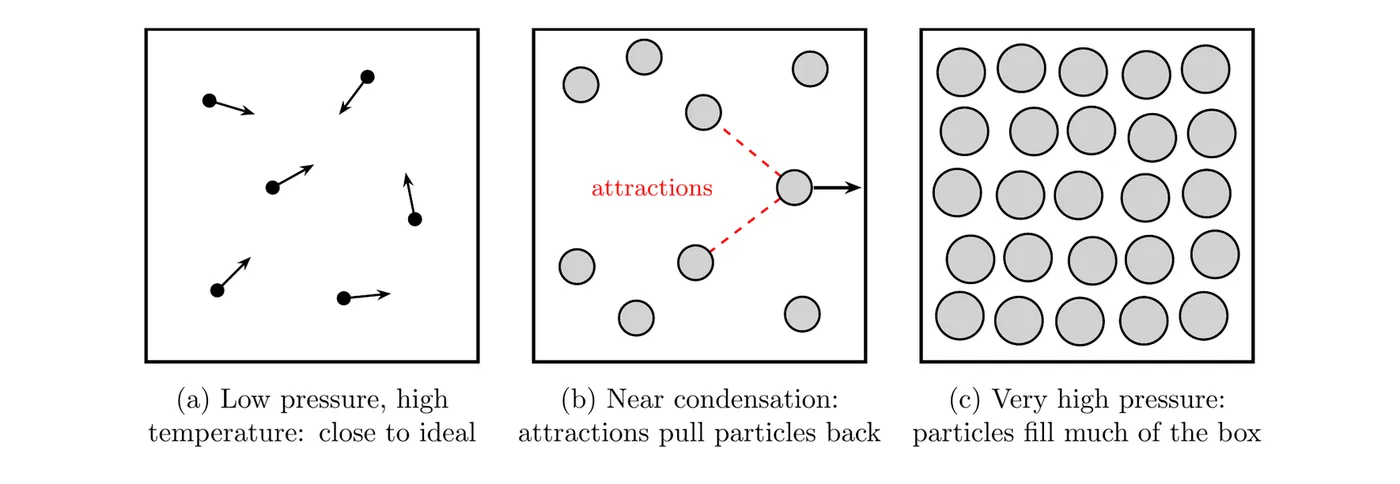
Deviation 1: attractions between particles
When gas particles are close together and moving slowly, the attractions between them start to matter. Picture a particle heading toward the wall in panel (b) above. Its neighbors pull back on it, so it hits the wall with less force. Some pairs of particles even stick together briefly, which acts like fewer separate particles. Fewer and softer wall collisions mean a lower pressure.
Result: attractions make the real pressure lower than the ideal gas law predicts (for the same , , and ). Put another way, if the pressure is held constant, the real gas takes up a smaller volume than predicted.
Attractions matter most at conditions close to those that cause condensation:
- Low temperature. Slow particles have less kinetic energy to pull free from each other's attractions. Condensation happens when the attractions win completely.
- Moderately high pressure. Particles are squeezed closer together, and intermolecular forces get much stronger as the distance shrinks.
Attractions also matter more for gases with stronger intermolecular forces. Compare gases by naming the actual forces:
Gas | Strongest intermolecular force | Deviation from attractions |
London dispersion only, 2 electrons (very small, hard to polarize) | Smallest | |
, | London dispersion only, but more electrons, so more polarizable | Larger |
Dipole-dipole, plus London dispersion from 32 electrons | Larger still | |
, | Hydrogen bonding | Largest for molecules of this size |
Deviation 2: the volume of the particles
At extremely high pressures, the particles are packed so tightly that their own volume is no longer a tiny fraction of the container (panel (c) above). The space a particle can actually move through is smaller than . With less room to move, particles hit the walls more often than the ideal model expects.
Result: particle volume makes the real pressure higher than the ideal gas law predicts (for the same , , and ). If the pressure is held constant, the real gas takes up a larger volume than predicted, because the particles themselves can't be squeezed into zero space.
Bigger molecules take up more space, so at the same very high pressure, a gas of large molecules shows this effect more than a gas of small ones.
Reading a graph of real gas behavior
A clean way to see both deviations is to graph the ratio against pressure. For an ideal gas this ratio is exactly 1 at every pressure, because . Chemists call this ratio the compressibility factor. You don't need the name, but you should be able to read the graph.
- : the real gas has a lower than an ideal gas would. Attractions are winning.
- : the real gas has a higher than an ideal gas would. Particle volume is winning.
The graph below uses measured data for nitrogen gas at two temperatures, from the NIST Chemistry WebBook.
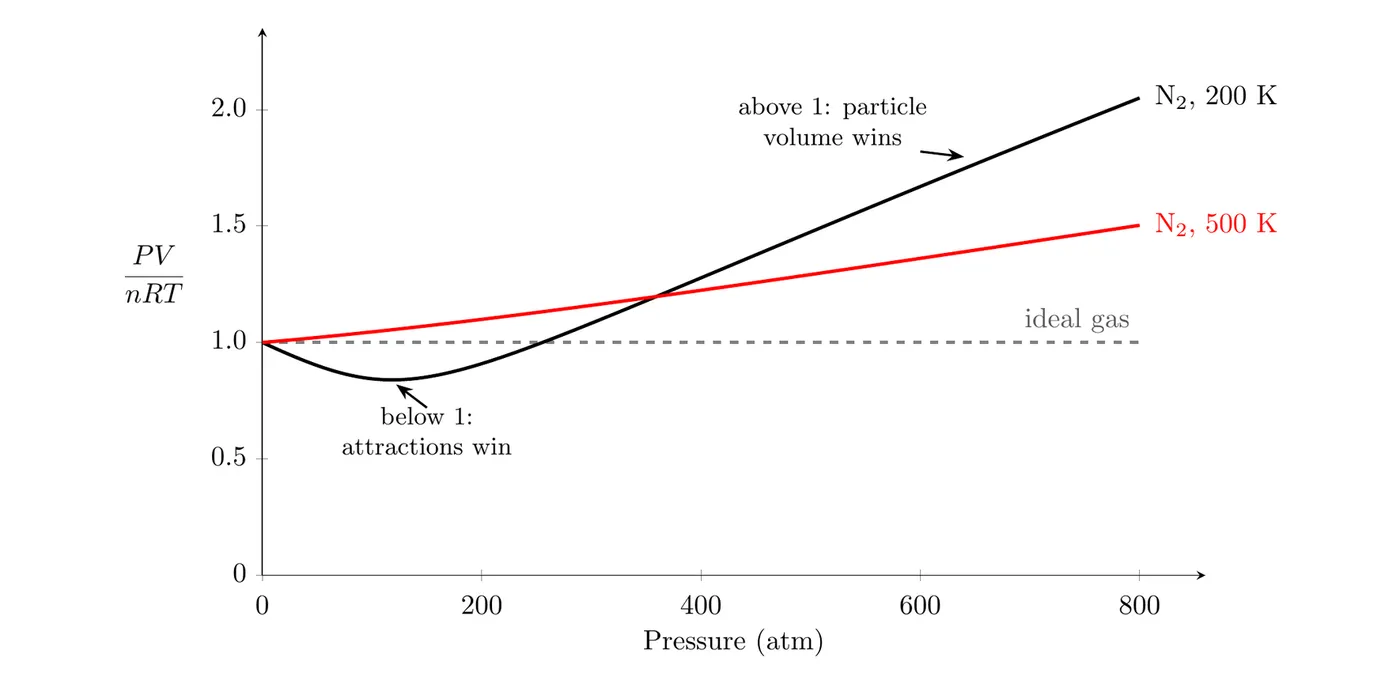
Here's how to read it:
- At low pressure, both curves start at 1. When particles are far apart, every gas behaves ideally.
- At 200 K, the black curve dips below 1 (its lowest point is about 0.84, near 120 atm). Nitrogen molecules are slow and fairly close together, so London dispersion attractions lower the pressure.
- At higher pressures, the black curve climbs above 1 and reaches about 2 at 800 atm. Now the molecules are crowded enough that their volume dominates.
- At 500 K, the red curve never dips below 1. The molecules move so fast that the attractions barely matter, and only the volume effect shows up.
Summary of conditions:
Conditions | Closest to ideal? | Main reason |
High temperature, low pressure | Yes | Particles are fast and far apart, so attractions and particle volume are both negligible |
Low temperature, moderately high pressure (near condensation) | No: lower than ideal | Attractions pull particles back from the walls |
Extremely high pressure | No: higher than ideal | Particle volume takes up a real share of the container |
There are equations that correct the ideal gas law for these effects (the best known is the van der Waals equation), but they are not on the AP reference sheet. On the exam you'll explain the direction of a deviation, not calculate it with a correction formula.
Example 1: Nitrogen in a cold cylinder
A steel cylinder with a volume of 0.277 L holds 2.00 mol of at 200. K. The pressure gauge reads 100. atm. (a) What pressure does the ideal gas law predict? (b) Calculate using the measured pressure. (c) Explain the difference at the particle level.
(a) Solve for :
(b) Use the measured pressure:
(c) The real pressure is about 16% lower than the ideal prediction, so the ratio is below 1. At 200 K the molecules move slowly, and at this pressure they are close together. The London dispersion forces between them pull each molecule back as it approaches the wall, so the molecules strike the walls with less force than the ideal model assumes. Answer: 118 atm predicted; ratio 0.844; attractions lower the real pressure.
Example 2: The same gas, squeezed much harder
The same 2.00 mol of at 200. K is compressed into 0.0841 L. The gauge now reads 800. atm. Compare this with the ideal prediction and explain.
Now the real pressure is about twice the ideal value. The molecules are packed so tightly that their own volume is a large part of the 0.0841 L. The free space they can move through is much smaller than the container volume, so they collide with the walls far more often than the ideal model predicts. Attractions are still there, but the volume effect is much bigger. Answer: 390. atm predicted vs. 800. atm measured; particle volume raises the real pressure.
Notice that Examples 1 and 2 are the two points on the black curve in the graph above, at 100 atm and 800 atm.
Example 3: Which gas deviates most? (AP-style)
Separate 1.00 mol samples of , , and are each placed in identical rigid containers at 300 K. At these conditions the ideal gas law predicts a pressure of 8.0 atm for each one. Which sample has a measured pressure furthest below 8.0 atm? Justify your answer.
Answer: . The pressure falls below the ideal value because of attractions between particles, so the gas with the strongest intermolecular forces deviates most.
- molecules are polar and form hydrogen bonds with each other (H bonded to N, attracted to a lone pair on N of a neighbor). These are much stronger than the forces in the other two gases. Ammonia's vapor pressure at 300 K is only about 10 atm, so at 8.0 atm this sample is close to condensing, which is exactly when attractions matter most.
- is nonpolar, so it has only London dispersion forces. With 10 electrons it is more polarizable than helium, so it deviates a little.
- has only London dispersion forces from 2 tightly held electrons, the weakest attractions of the three. Its pressure is closest to ideal (at this low pressure it is actually a hair above 8.0 atm, from its small particle volume).
Ranking from closest to ideal to furthest below ideal: .
Example 4: Making a gas behave more ideally (AP-style)
A sample of is in a rigid container, and its measured pressure is noticeably lower than the ideal gas law predicts. Which change would make the gas behave more ideally? (A) Lower the temperature. (B) Add more at the same temperature. (C) Raise the temperature. Explain.
Answer: (C). The pressure is lower than ideal, so attractions between molecules are the problem. is nonpolar, but each molecule has 22 electrons, so its London dispersion forces are fairly strong. Raising the temperature makes the molecules move faster, so they have more kinetic energy relative to the attractions, and the attractions have less effect on each wall collision. Choice (A) does the opposite and moves the gas closer to condensing. Choice (B) crowds the molecules closer together in the same volume, which strengthens the attractions they feel.
Common mistakes
- Getting the direction backward. Attractions make the real pressure lower than ideal. Particle volume makes it higher. Tie each one to wall collisions: attractions soften them, crowding makes them more frequent.
- Blaming particle volume at low temperature. Cold gases deviate mainly because of attractions. Particle volume only takes over at extremely high pressures.
- Saying "strong forces" without naming them. Graders want the actual force: hydrogen bonding, dipole-dipole, or London dispersion, and why it's stronger (more electrons, a dipole, H bonded to N, O, or F).
- Thinking any gas is ideal at any conditions. Even helium deviates at high enough pressure. "Most ideal" means high temperature and low pressure.
- Treating the ideal gas law as useless for real gases. At ordinary conditions it is usually within a few percent, which is why you keep using it.