

3.8 - Representations of Solutions
Overview
A particulate diagram is a drawing of what's happening at the level of particles. For solutions, the AP exam asks you to draw or interpret these diagrams in two ways: to show how concentrated each component is, and to show how the components interact with each other. These show up in both multiple-choice and free-response questions, because a good diagram proves you understand both the formula and the forces involved.
What a particulate diagram of a solution shows
A diagram is a tiny window into a solution. It should get two things right:
- Concentrations. The relative number of each kind of particle in the window matches the formula and the molarity.
- Interactions. Particles that attract each other are drawn so the attraction makes sense, such as the partially negative end of water facing a cation.
Water molecules are often left out to keep the drawing readable. If you leave them out, say so ("water molecules not shown"). If the question is about interactions with the solvent, you have to draw some of them.
Representing concentration
Concentration is particles per volume. In a diagram, the window has a fixed volume, so a more concentrated solution has more solute particles in the same-size window.
Get the particle types and ratios from what happens when the solute dissolves (Topic 3.7):
- Soluble ionic compounds separate into ions in the ratio of the formula. Draw the ions apart from each other, not as pairs. Polyatomic ions such as and stay together as one particle.
- Molecular solutes such as glucose, ethanol, or sucrose stay whole. Don't break them into atoms or ions.
- Sizes and charges: use sensible relative sizes from the ionic radius trends in Unit 1 (for example, is much smaller than ), and label every charge clearly.
The three windows below have the same volume and each started with 3 formula units of solute, so all three solutions have the same molarity of solute. The number of dissolved particles is different because of how each one dissolves:
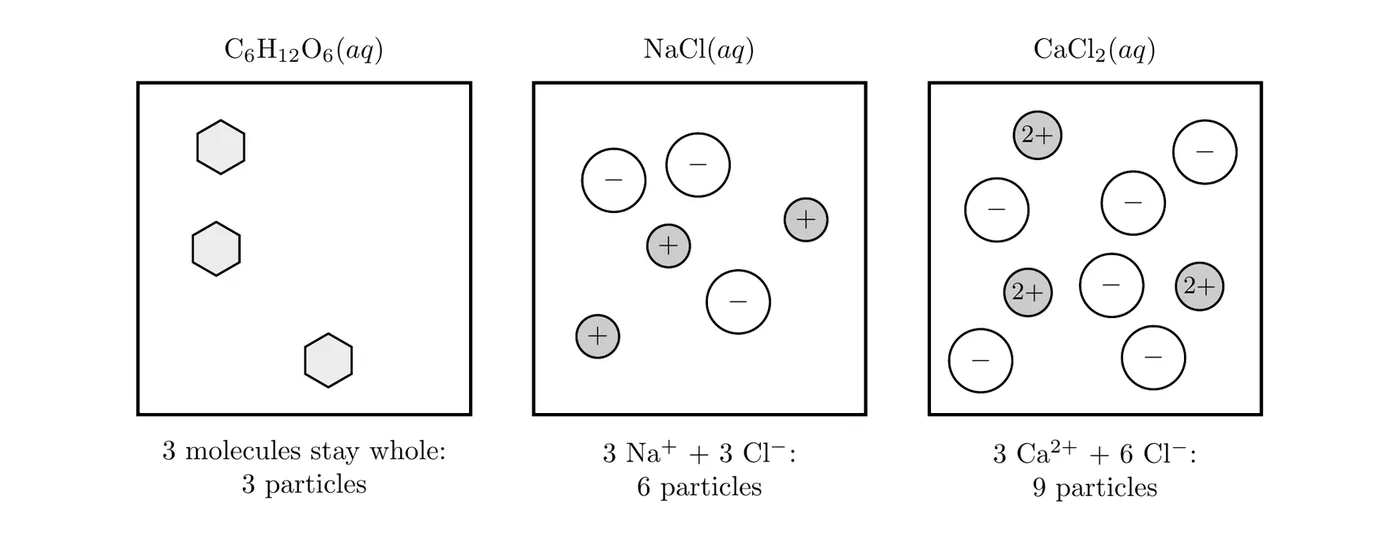
Dilution in a diagram: adding water spreads the same solute particles through a larger volume. If the volume doubles, a window of the same size shows half as many solute particles.
Representing interactions
Ions in water: ion-dipole interactions
Water is polar. Its O end carries a partial negative charge () and its H ends carry partial positive charges (). When an ionic compound dissolves, water molecules surround each ion, a process called hydration. The attraction between an ion and the polar water molecules is an ion-dipole interaction, and its orientation follows Coulomb's law: opposite charges face each other.
- Around a cation, water molecules point their O atoms inward.
- Around an anion, water molecules point an H atom inward.
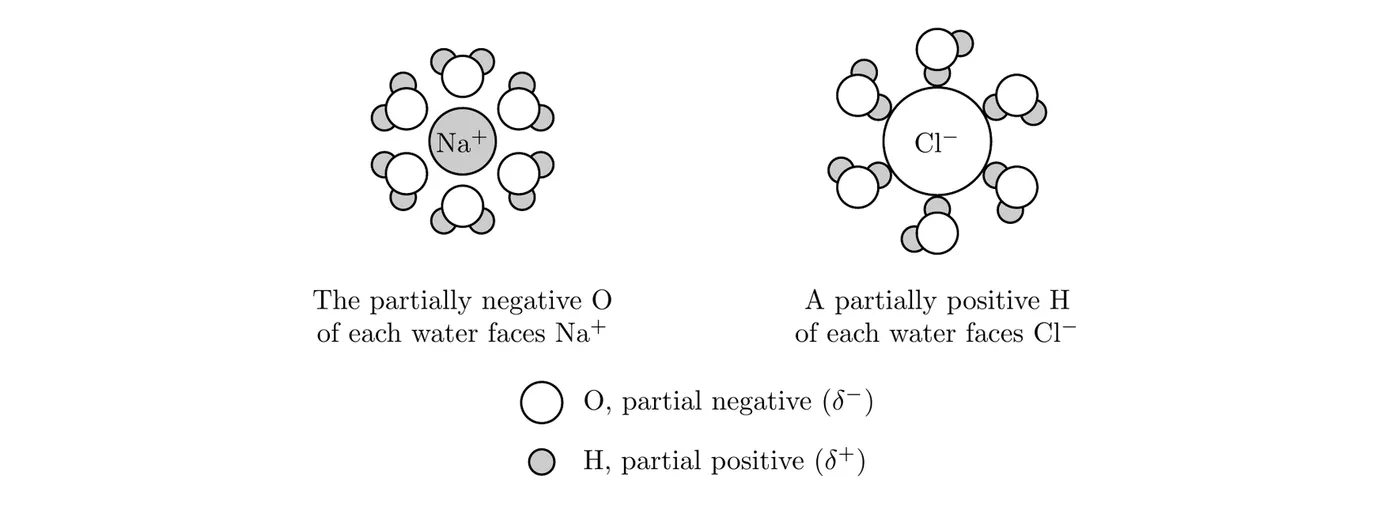
Getting this orientation right is one of the most tested details in solution diagrams. A diagram with H atoms pointed at shows a repulsion between two positive charges and loses the point.
Molecules in water: hydrogen bonds and dipole-dipole forces
Molecular solutes interact with water through intermolecular forces. A solute with an O-H or N-H group, like methanol () or ethanol, forms hydrogen bonds with water. Draw a hydrogen bond as a dashed or dotted line from an H (bonded to N, O, or F) on one molecule to a lone pair on an N, O, or F of the other molecule. The H-bond is between molecules, so it's longer than the covalent O-H bond.
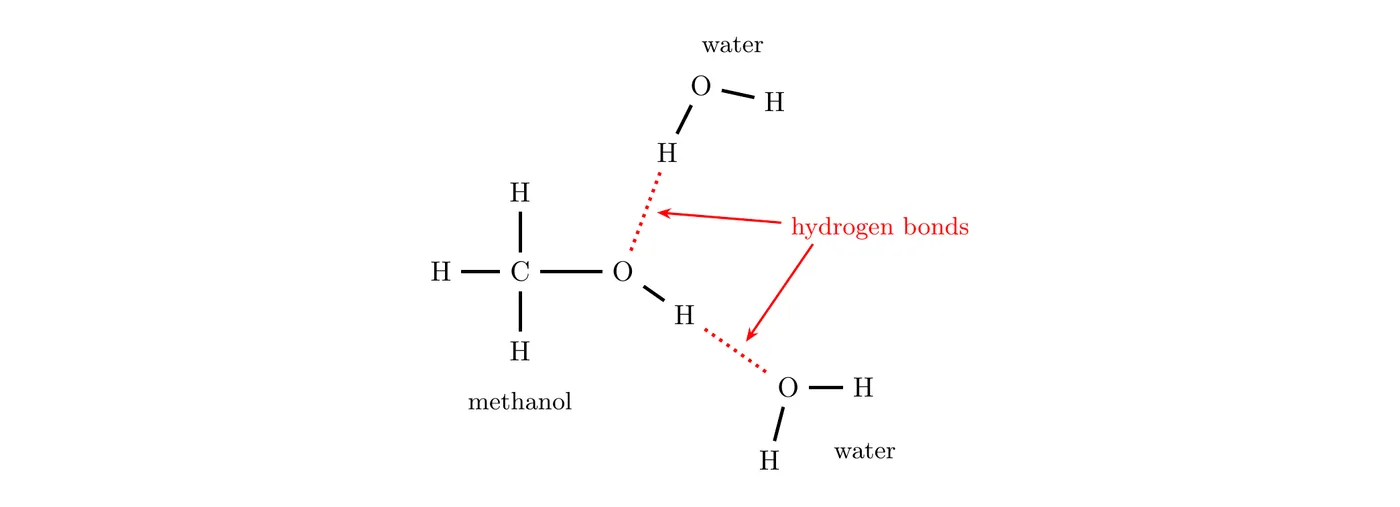
Methanol both donates an H to a water molecule and accepts an H from another water molecule. That two-way hydrogen bonding is why methanol and water mix in any proportion.
Nonpolar mixtures
Two nonpolar substances, such as hexane dissolved in pentane, interact only through London dispersion forces. A diagram just shows the molecules mixed evenly with no special orientation. Compare that to hexane added to water: hexane can't hydrogen bond, so the water molecules stay hydrogen bonded to each other and the hexane forms a separate layer. A correct diagram of that mixture shows two regions, not one mixed solution. Topic 3.10 explains this "like dissolves like" idea in detail.
A checklist for drawing solution diagrams
- Write the dissolving equation, and use it to get the particle types and their ratio.
- Keep polyatomic ions and molecular solutes whole.
- Count: the number of particles in the window matches the ratio, and the concentration if one is given.
- Draw ions separated from each other, with charges labeled and sensible sizes.
- If you draw water: O toward cations, H toward anions, and hydrogen bonds to the right atoms.
- Include a key or a note for anything not obvious, such as "water molecules not shown."
What's not on the exam: colligative properties (like boiling point elevation and freezing point depression) are not assessed, and calculations of molality, percent by mass, and percent by volume are not assessed.
Example 1: Reading a diagram
The diagram shows a window of an aqueous solution of one ionic compound. Water molecules are not shown.
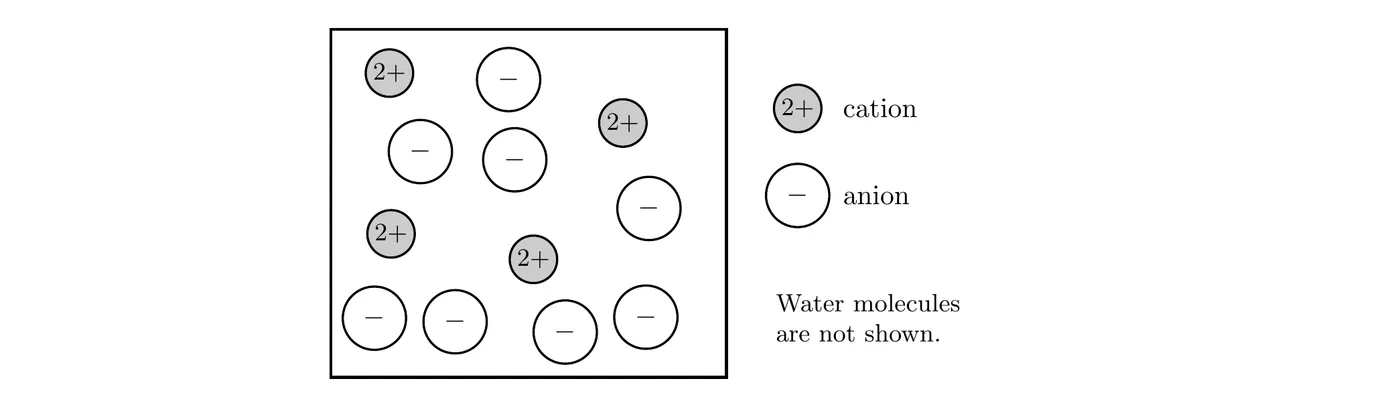
(a) Which of these could the solute be: , , , or ? (b) Each ion drawn represents 0.010 mol of that ion, and the window represents 200. mL of solution. Find the concentration of each ion and of the compound.
(a) Count: 4 cations with a charge and 8 anions with a charge. The ratio is 1 cation to 2 anions, and the charges balance: . Only fits ( and 2 ). is 1 to 1, has a cation and a anion, and is 1 to 3.
(b)
Answer: the solute is . The solution is , with and . (0.010 mol has 2 significant figures, so the answers have 2.)
Example 2: Drawing a dilution
A window of a solution of a molecular solute contains 8 solute particles. A student adds an equal volume of water to the solution. How many solute particles should a window of the same size show after mixing, and what is the new concentration?
The moles of solute stay the same and the volume doubles:
Half the concentration means half as many particles in a window of the same volume: 4 particles. Spread them evenly, because the solution is still homogeneous after mixing.
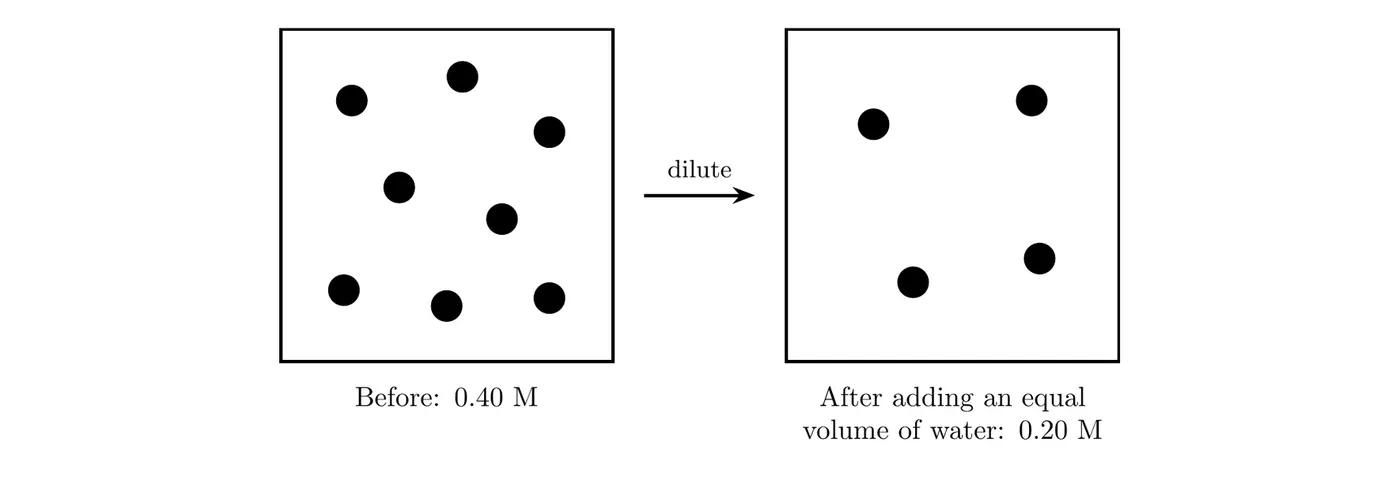
A common wrong answer is to draw the same 8 particles in the same-size window. That would mean the concentration didn't change.
Example 3: Which diagram is correct? (AP-style)
A student draws two diagrams of a potassium ion, , in water. Which diagram correctly shows the interactions between and water? Justify your choice, and describe how a correct diagram of in water would differ.

Answer: Diagram 2. Each water molecule is polar, with a partial negative charge on the O atom and partial positive charges on the H atoms. is positive, so it attracts the partially negative O end of each water molecule. Diagram 2 shows the O atoms facing the ion, which is an ion-dipole attraction. Diagram 1 points an H atom at , which would put two positive charges next to each other, a repulsion.
For , the water molecules would turn around: each would point a partially positive H atom toward the negative fluoride ion, with the O atoms facing outward.
Example 4: Describing a diagram in words
Describe a correct particulate diagram for a window of that contains 3 sulfate ions, with water not shown.
Answer: 6 separate ions and 3 separate ions, spread evenly through the window and not touching as pairs. Each sulfate is drawn as one particle (one S with four O atoms) with a charge. Drawing loose S and O atoms, or 4 separate ions, would be wrong, because the covalent bonds inside a polyatomic ion don't break when it dissolves.
Common mistakes
- Water pointing the wrong way. O faces cations, H faces anions. Check every water molecule you draw.
- Drawing ions as pairs. In solution, and are separated and surrounded by water, not stuck together as units.
- Wrong ratios. needs twice as many as . Count before you finish.
- Breaking up molecules or polyatomic ions. Sugar doesn't split into C, H, and O, and stays one ion.
- Same number of particles after dilution. A same-size window of a more dilute solution has fewer solute particles.
- Hydrogen bonds to the wrong atom. The H in a hydrogen bond must be bonded to N, O, or F, and it points to a lone pair on N, O, or F. The H atoms on carbon in methanol don't hydrogen bond.