

3.13 - Beer-Lambert Law
Overview
When light passes through a colored solution, some of it is absorbed. The Beer-Lambert law (often just called Beer's law) says how much: absorbance depends on how strongly the substance absorbs light, how far the light travels through the solution, and the concentration. Absorbance is easy to measure, so Beer's law is one of the most common ways to find the concentration of a solution. AP questions often set it up as a lab and ask how a mistake would change the results.
Measuring absorbance with a spectrophotometer
A spectrophotometer shines light of one chosen wavelength through a sample and measures how much comes out the other side.
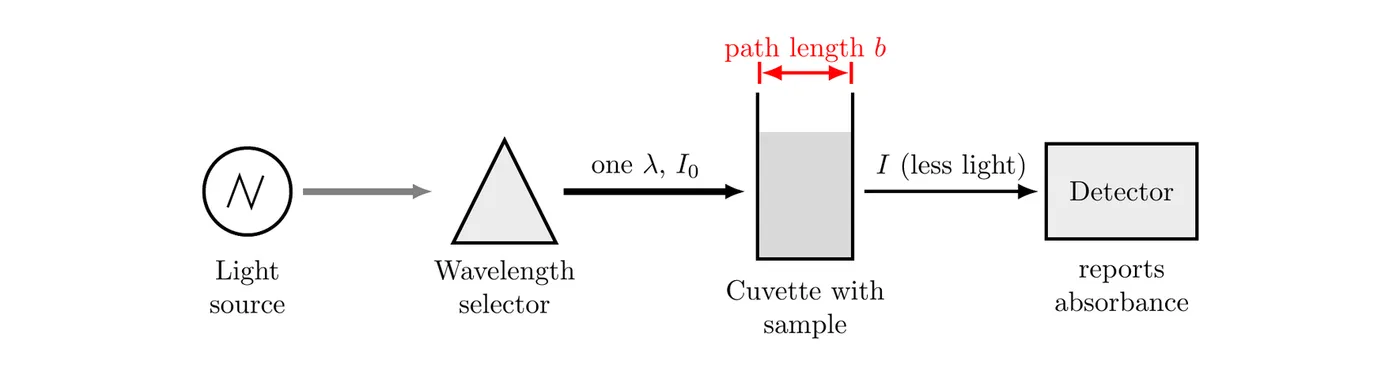
- A light source gives off many wavelengths.
- A wavelength selector picks out one wavelength, .
- That light, with intensity , passes through the sample in a small, clear container called a cuvette. The distance the light travels through the solution is the path length, , usually 1.00 cm.
- The detector measures the intensity of the light that makes it through, , and the instrument reports the absorbance, .
The more light the sample absorbs, the less reaches the detector and the higher the absorbance. Absorbance has no units. Some instruments also report percent transmittance, the percent of the light that gets through: . Absorbance and transmittance move in opposite directions.
Before measuring samples, you blank the instrument: you measure a cuvette filled with only the solvent and set that reading to . That way, light lost to the solvent or the cuvette walls isn't counted as absorbance by the solute.
The Beer-Lambert law
Symbol | Meaning | Usual units |
absorbance | none | |
molar absorptivity | (the same as ) | |
path length | cm | |
concentration of the absorbing species | M (mol/L) |
- Molar absorptivity () describes how intensely a substance absorbs light of a specific wavelength. It's a property of the substance at that wavelength: a different substance, or the same substance at a different wavelength, has a different . It does not change with concentration.
- Path length () and concentration () are both proportional to the number of absorbing particles in the light's path. A longer path means the light passes more particles. A more concentrated solution packs more particles into the same path. Either way, more photons get absorbed.
Because is directly proportional to each variable, you can often reason without a calculator. Double the concentration and the absorbance doubles. Use a cuvette half as wide and the absorbance is cut in half.
Example 1: Finding concentration from absorbance
A blue food dye has a molar absorptivity of at 630 nm. A solution of the dye in a 1.00 cm cuvette has an absorbance of 0.468 at 630 nm.
(a) Find the concentration of the dye. Solve the Beer-Lambert law for :
(b) Predict the absorbance of the same solution in a 0.500 cm cuvette. The path length is cut in half, so the absorbance is cut in half: .
(c) A student dilutes 25.00 mL of the solution to a total volume of 100.0 mL. Predict the new absorbance in a 1.00 cm cuvette. The volume goes up by a factor of 4, so the concentration drops by a factor of 4, to M. Absorbance is proportional to concentration:
Holding path length and wavelength constant
In most experiments, every measurement uses the same cuvette (the same ) and the same wavelength (the same ). Then is just a constant, and absorbance depends only on concentration:
A graph of absorbance versus concentration is a straight line through the origin, with a slope equal to . This is how you find an unknown concentration in the lab.
Building a calibration curve
- Make several standard solutions of the substance with known concentrations, usually by diluting a stock solution.
- Set the spectrophotometer to the right wavelength and blank it with the solvent.
- Measure the absorbance of each standard.
- Plot absorbance versus concentration and draw the best-fit line. This is the calibration curve (or standard curve).
- Measure the absorbance of the unknown, then use the line or its equation to find the unknown's concentration.
The unknown's absorbance should fall within the range of the standards. If it's higher than the most concentrated standard, dilute the unknown by a known factor, measure it again, and multiply the result by the dilution factor.
Choosing the wavelength
Before running standards, chemists record an absorption spectrum: the absorbance of the substance at each wavelength. The spectrum below is for a M solution of the blue dye from Example 1, in a 1.00 cm cuvette.
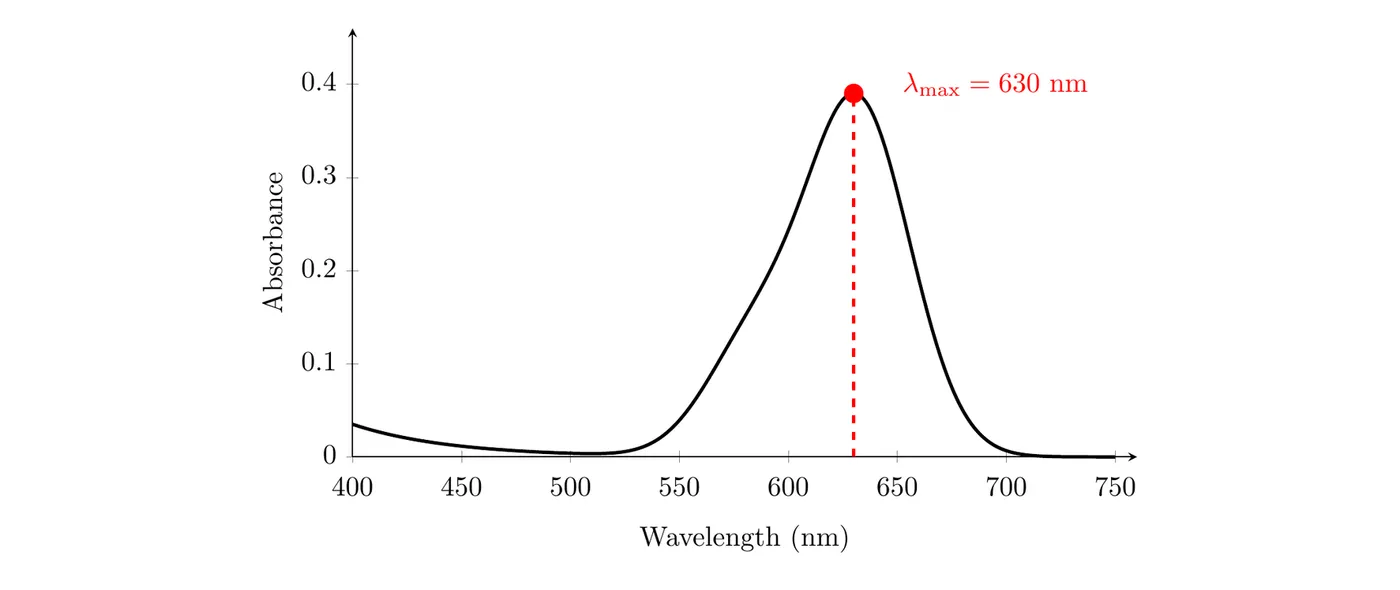
The spectrophotometer is usually set to the wavelength of maximum absorbance, , called the optimum wavelength. For this dye it's 630 nm. Here's why:
- Maximum sensitivity. At , is as large as it gets, so the calibration line is as steep as possible. A small change in concentration gives the biggest possible change in absorbance, which makes similar concentrations easy to tell apart.
- Less effect from small wavelength errors. The top of the peak is nearly flat, so if the instrument's wavelength is off by a nanometer or two, the absorbance barely changes. On the steep side of the peak, the same small error would change the reading a lot.
- Only the species you want. If a sample contains more than one colored substance, choose a wavelength where the one you're measuring absorbs strongly and the others don't, so the reading reflects only that substance.
This connects to Topic 3.11: the dye looks blue because it absorbs orange-red light, so its peak sits in the orange-red part of the visible spectrum.
Example 2: Dye in a sports drink (AP-style)
A student wants to find the concentration of a blue dye in a sports drink. She prepares five standard solutions of the dye, measures each at 630 nm in a 1.00 cm cuvette, and records the data below.
Concentration (M) | Absorbance |
0.128 | |
0.262 | |
0.389 | |
0.522 | |
0.648 |
The best-fit line for the data is . The sports drink, measured the same way, has an absorbance of 0.412.
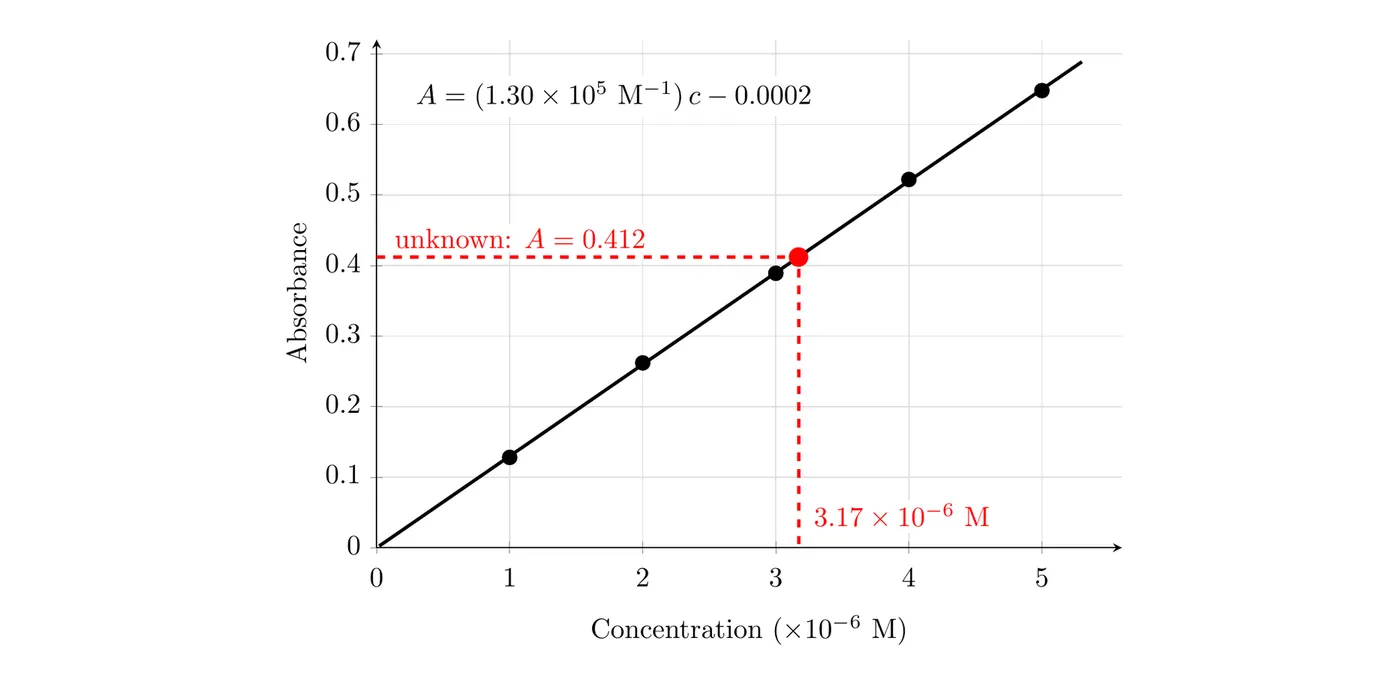
(a) Find the concentration of the dye in the sports drink. Solve the best-fit equation for :
The intercept is so close to zero that ignoring it gives the same answer, just as Beer's law predicts. You can also read the value off the graph: go across from to the line, then straight down to the concentration axis. The unknown falls between the M and M standards, inside the calibration range, so the result is reliable.
(b) Find the molar absorptivity of the dye at 630 nm. The slope of the line equals :
(c) A bottle holds 591 mL of the drink, and the molar mass of the dye is 793 g/mol. What mass of dye is in the bottle? First find the moles of dye, keeping an extra digit:
Answer: the bottle contains g (1.49 mg) of dye.
Sources of experimental error
AP questions often describe a mistake in a Beer's law lab and ask whether the calculated concentration would be too high, too low, or unaffected. Reason in two steps:
- Decide how the mistake changes the measured absorbance: is it higher or lower than it should be?
- The calculated concentration moves in the same direction as the absorbance, since (on a graph, the calibration line slopes upward).
Mistake (affecting only the unknown) | Measured absorbance | Calculated concentration |
Fingerprints, smudges, or scratches on the cuvette | too high (less light reaches the detector) | too high |
Cuvette still wet with distilled water when the sample was added | too low (the sample was diluted) | too low |
Air bubbles stuck in the light path | usually too high (bubbles scatter light away from the detector) | usually too high |
A cuvette with a longer path length than the one used for the standards | too high (more particles in the light path) | too high |
Instrument set to a wavelength away from | too low (smaller ) | too low |
Two more things to watch for:
- Errors that affect everything equally can cancel. If the standards and the unknown are all measured at the same off-peak wavelength, the calibration line is just less steep, and the unknown is read from that same line. The answer is still valid, though the method is less sensitive.
- Readings outside the calibration range aren't reliable. If the unknown's absorbance is higher than the highest standard, the straight line may not hold out there. Dilute the sample and measure again.
Example 3: Explaining an error (AP-style)
A student builds a calibration curve correctly. Before measuring the unknown, she rinses the cuvette with distilled water, then pours in the unknown without drying the cuvette or rinsing it with the unknown solution. Will the concentration she calculates be too high, too low, or unaffected? Justify your answer.
Answer: too low. The leftover water dilutes the unknown in the cuvette, so there are fewer dye particles in the light path than there should be. Fewer absorbing particles means the measured absorbance is lower than it should be. Since concentration is proportional to absorbance (), the calculated concentration is also too low.
How to avoid it: before filling the cuvette, rinse it two or three times with small portions of the solution you're about to measure.
Common mistakes
- Plugging percent transmittance into the equation. uses absorbance, not . Higher absorbance means lower transmittance.
- Unit slips. With in , the path length must be in cm and the concentration in mol/L. Watch for M, mM, and mm.
- Treating molar absorptivity as a variable. depends on the substance and the wavelength, not on concentration or path length.
- Saying an error makes results “inaccurate” and stopping there. AP questions want a direction (too high or too low) and a reason tied to absorbance.
- Forgetting the line goes through the origin. Zero concentration means zero absorbance after blanking. A large intercept is a sign that something went wrong, like a bad blank.
- Reading beyond the standards. Only trust concentrations inside the range of your calibration curve.